Property prices per m² in Europe: from official records of what homes actually sold for.
// Short answer
These pages give the price per m² that homes actually sold for, from each country's own records of sales: France's DVF, Statistics Portugal, Croatia's sale-price register and Berlin's valuation committee. None of them are asking prices. The table puts the headline figure for each place side by side, and says which statistic it is, because a median and an average are not the same number.
Headline figures as published on each city page, October 2026. Sale prices from official records.
On this page
What does a home cost per m² across Europe?
From EUR 1,584 per m² for a Dordogne house to EUR 13,854 for a Val d'Isère ski apartment, on the headline figure for each place. Each city page breaks its figure down by district, parish or town.
| Place | Per m² | Statistic | Source |
|---|---|---|---|
| Val d'Isère | EUR 13,854 | Median, apartments | DVF, 2025 |
| Courchevel | EUR 11,846 | Median, apartments | DVF, 2025 |
| Saint-Tropez | EUR 11,826 | Median, apartments | DVF, 2025 |
| Chamonix | EUR 9,913 | Median, apartments | DVF, 2025 |
| Paris | EUR 9,722 | Median, apartments | DVF (tax administration), every 2025 sale |
| Hamburg | EUR 6,345 | Average, apartments | Hamburg valuation committee, 2025 |
| Cannes | EUR 5,721 | Median, apartments | DVF, 2025 |
| Berlin | EUR 5,511 | Average, apartments | Berlin valuation committee, 2025 |
| Lisbon | EUR 5,082 | Median, homes | Statistics Portugal (INE), 12 months to March 2026 |
| Dinard (houses) | EUR 4,932 | Median, houses incl. land | DVF, 2025 |
| Nice | EUR 4,852 | Median, apartments | DVF, 2025 |
| Aix-en-Provence | EUR 4,818 | Median, apartments | DVF, 2025 |
| Cascais | EUR 4,687 | Median, homes | INE, 12 months to March 2026 |
| Lyon | EUR 4,468 | Median, apartments | DVF, 2025 |
| Bordeaux | EUR 4,120 | Median, apartments | DVF, 2025 |
| Dubrovnik | EUR 3,940 | Average, apartments, ex VAT | Croatian ministry, from 2025 sales |
| Split | EUR 3,738 | Average, apartments, ex VAT | Croatian ministry, from 2025 sales |
| Porto | EUR 3,510 | Median, homes | INE, 12 months to March 2026 |
| Funchal (Madeira) | EUR 3,322 | Median, homes | INE, 12 months to March 2026 |
| Algarve | EUR 3,240 | Median, homes | INE, 12 months to March 2026 |
| Dordogne (houses, whole department) | EUR 1,584 | Median, houses incl. land | DVF, 2025 |
A median is the middle sale; an average is pulled up by a few expensive ones, so an average city figure tends to sit higher than a median would. Croatia's figures exclude VAT, which a new build carries at 25%. Read each page's method before comparing two cities closely.
Sources
Why sale prices and not asking prices?
Because asking prices are what sellers hope for, and sale prices are what buyers paid. Listing sites publish the first; these records hold the second, for every registered sale, so a city figure is not skewed by flats that never sold.
Where no official sale data could be reached, there is no page here: Spain's notarial statistics are only available inside Spain, Dubai's land department data sits behind a captcha, and Italy's tax agency publishes estimated values rather than sale prices. For Thailand, the figures are asking prices from listings, labelled as such: how much is a condo in Thailand.
How do you use these figures on a real listing?
Divide the asking price by the area and compare it with the median and the middle half for its district or town on the city page. Above the top of the middle half, the home needs a reason.
Use the same area measure the source uses: built surface for DVF, gross private area for Portugal, living space for Berlin. Then add the purchase costs, which differ by country.
A city median still mixes very different homes. The Custom Report checks the unit itself: every listing in your budget, ranked against comparable homes in the same area, so you can check the unit clears the bar before you sign.
Sources
// Buying in Europe?
Every listing in your budget, ranked on net yield, appreciation and resale. Any market with public listing data; book a free call first so I can confirm your city has the data.
See the $499 report, page by pageFrequently Asked Questions
Which place on this list is the most expensive per square metre?
Are these asking prices?
Why do some figures say median and others average?
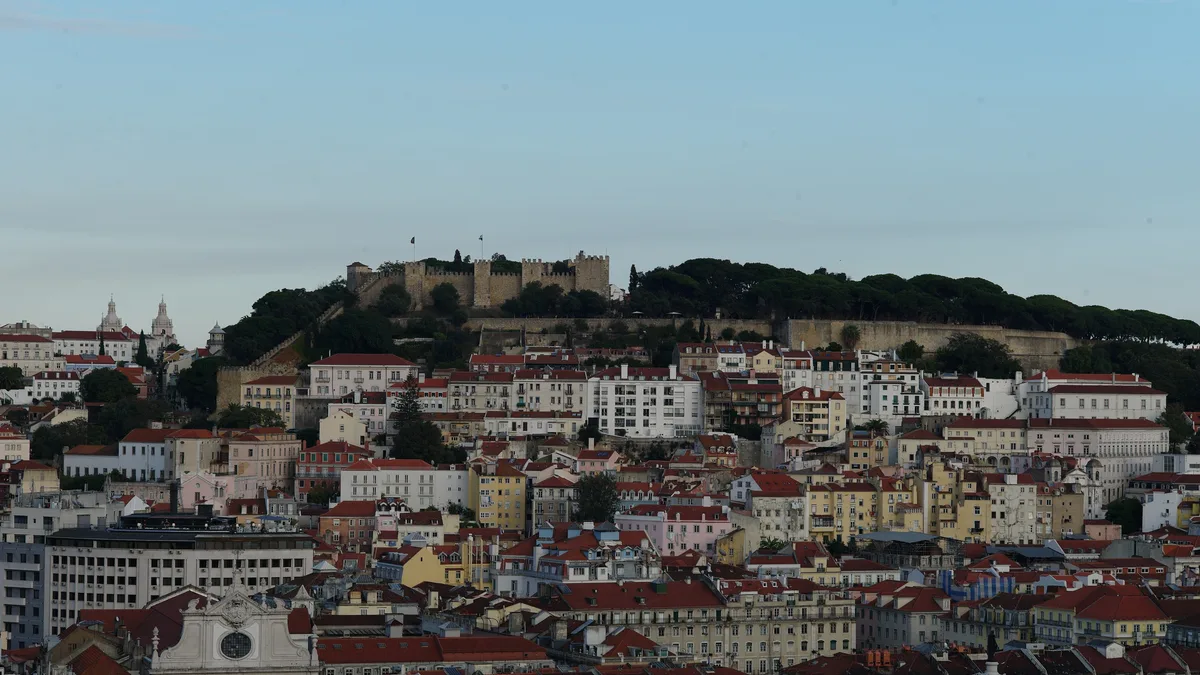
Header photo: Pedro Ribeiro Simões, CC BY 2.0, via Wikimedia Commons. All credits: image credits.