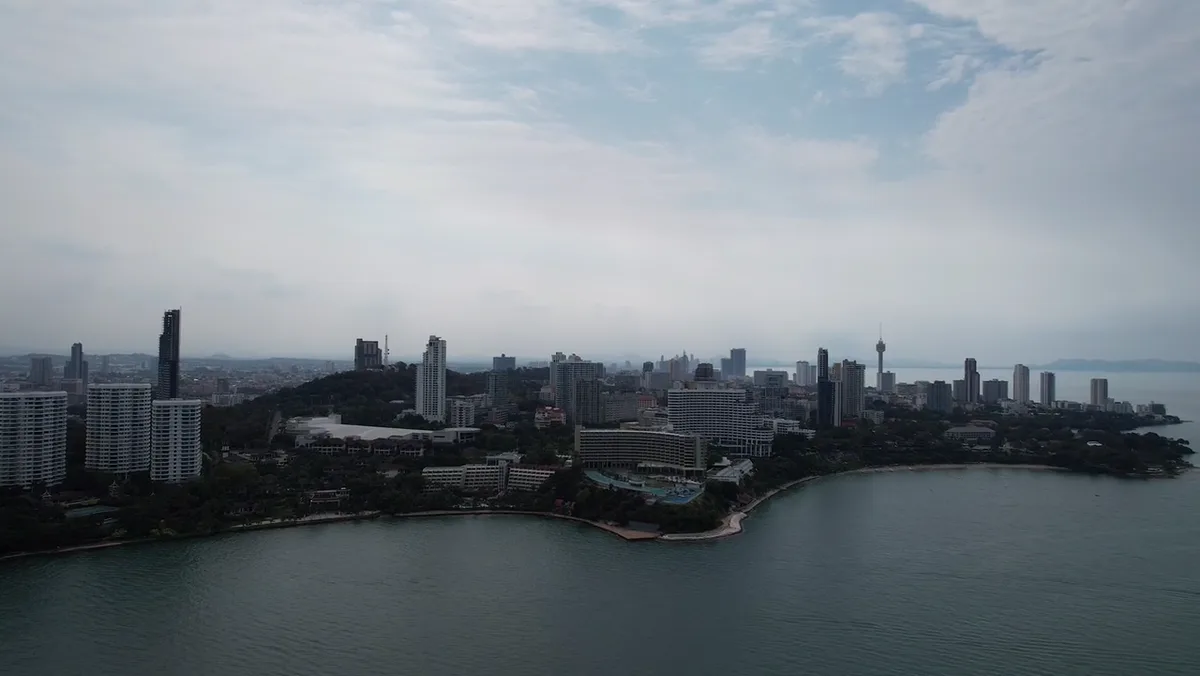
Pattaya vs Phuket: which market the numbers favour, and for whom
Both are Thai coastal condominium markets and the comparison usually stops there. Underneath, they are shaped very differently: one is concentrated and deep, the other dispersed and broad. I ran the same collection and the same validation standard over each, and this page reports what came back. Entry prices and net ranges are kept in separate sections, deliberately.

// Short answer
Which market does the data favour? Neither, outright. Phuket is far broader: 11,997 distinct listings across 1,515 named buildings, resolving into eight reportable catchments. Pattaya is narrower and denser: 4,903 listings across 320 buildings, resolving into two. Phuket carries the higher median rent per square metre and the wider geographic choice; Pattaya carries far more units inside each building it publishes. The answer depends on whether the buyer needs breadth or depth, and the page below separates the two so it can be decided rather than asserted.
How much inventory does each market actually have?
Phuket is roughly two and a half times deeper on listings and nearly five times deeper on named buildings. 11,997 distinct listings across 1,515 named buildings against Pattaya's 4,903 across 320. Both figures are deduplicated on a composite key, from September 2026 pulls.
Those two counts come from the same reproducible command over the two city workbooks, so the comparison is like for like rather than one city's marketing against another's. Against the full four-city dataset of 33,030 distinct Thai listings, Phuket is the joint-largest leg alongside Bangkok's 12,097 and Pattaya is the third at about 15 percent of the total.
The building count is the more revealing of the two numbers. 1,515 named buildings against 320 is not a difference in market size so much as a difference in market shape. Phuket's condominium stock is distributed across a large number of comparatively small projects spread around the island. Pattaya's is concentrated into a smaller number of large towers. That single structural fact drives most of what follows.
How many buildings survive the same validation standard in each?
Phuket published 61 buildings carrying 1,235 units. Pattaya published 51 buildings carrying 2,233 units. Phuket enters the stage with nearly five times the buildings and finishes with about 20 percent more published, while Pattaya's published buildings carry nearly twice the units between them.
| Measure | Pattaya | Phuket |
|---|---|---|
| Distinct listings | 4,903 | 11,997 |
| Named buildings in sale data | 320 | 1,515 |
| Assessed at 3+ units | 147 | 110 |
| Published after rent validation | 51 | 61 |
| Units inside the published file | 2,233 | 1,235 |
| Multi-verified rent evidence | 42 | 43 |
| Catchments with 3+ published buildings | 2 | 8 |
September 2026 pulls, same collection method and same validation standard applied to each city. Buildings are counted separately from listings. No price or income figure appears in this table by design.
Pattaya converts a far higher share of what it starts with, and the reason is the tower structure. In a large building, three or more units on the market simultaneously is ordinary, so the unit-count threshold is easy to clear and rent comparables are plentiful for that specific address. In a market of many small projects, the same threshold removes a great deal of genuine stock.
Neither result is a verdict on the buildings that did not make it. A building is absent from a published file because its rent evidence could not be corroborated across independent platforms, which is a statement about the available evidence and not about the asset.
| Evidence | Pattaya | Phuket |
|---|---|---|
| Median asking consensus rent per square metre per month | 393.5 | 532.7 |
| The range behind that median | 239.1 to 707.7 | 333.3 to 793.7 |
| Sale platforms behind the listing data | Two, and 99.6 percent one of them: 8,094 of 8,125 rows | Five |
| Buildings whose platforms disagreed enough to flag | 9 mild-divergent of 51 published | 18 of 61 |
| What a thinner base does to the figure | A file dominated by one platform inherits that platform’s coverage and its listing conventions, with no independent signal to reveal where the gaps are | Broader corroboration, which is a reason to hold the Phuket figures more firmly — not a verdict on any building |
On a narrow screen, scroll the table sideways for the remaining column.
September 2026 pulls, the same collection method and the same validation standard applied to each city. Cross-source asking rents, grouped by named building and retained only where independent platforms agreed within a defined tolerance. They are what landlords advertise, not achieved rents. No price and no income figure appears in this table by design.
How many distinct catchments does each market resolve into?
Phuket resolves into eight catchments carrying three or more published buildings each, spread across fifteen areas in total. Pattaya resolves into two. This is the largest structural difference between the two markets and the one most likely to decide the question.
Phuket's eight run from the Bang Tao and Laguna strip through the Thalang corridor, Rawai and Nai Harn, Patong, Surin and Kamala, Chalong, Kathu and the Phuket Town areas. Each is a genuinely separate sub-market with its own price level, its own tenant profile and its own stock characteristics. They are ranked against each other in the Phuket catchment ranking.
Pattaya's two are Nong Prue, which contains Pratumnak and much of Jomtien, and Na Kluea with Wongamat. The familiar neighbourhood names do not survive contact with the tambon boundaries the data uses, and separating Pratumnak from Jomtien is not something this evidence can do honestly. That is set out in the Pattaya catchment ranking and argued at length in the Jomtien and Pratumnak page.
For a buyer, the practical consequence is straightforward. If the decision is which part of the market to be in, Phuket offers eight evidenced answers and Pattaya offers two. If the decision is which building to buy, the catchment count is close to irrelevant and the depth of units behind each published building matters more.
How do entry prices compare across the two?
Measured across each city's published file, the median building's asking price is ฿4,200,000 in Pattaya and ฿3,850,000 in Phuket. Pattaya's published buildings sit about 9 percent higher at the median. Both are asking prices and neither is a transacted figure.
| Asking price, published file | Pattaya | Phuket |
|---|---|---|
| Median building | ฿4,200,000 | ฿3,850,000 |
| Lowest building median | ฿1,375,000 | ฿1,900,000 |
| Highest building median | ฿10,590,000 | ฿11,500,000 |
| Buildings behind the figure | 51 | 61 |
September 2026 pulls. Each row is a median of per-building median asking prices inside that city's rent-validated published file, which is a stricter and much smaller population than the full listing set. No income figure appears in this section.
The headline gap is smaller than most people expect, and the more useful observation is at the bottom of the range rather than the middle. Pattaya's cheapest published building sits materially below Phuket's, which reflects the mid-market tower stock that makes up much of Nong Prue. At the top the two markets converge.
A caution about reading these two numbers against each other too confidently: they are medians of published buildings, and the published set is selected on rent evidence rather than on price. Each city's wider asking-price picture, by area and with its own sample sizes, is published separately in Pattaya condo prices by area and Phuket condo prices by area. Those populations are wider and the figures differ accordingly.
The same checks, as a step-by-step protocol you run on any Thai condo before you pay.
Get The $20 Thailand Underwriting ProtocolHow does rent per square metre compare?
Phuket is materially higher: a median asking consensus of 532.7 baht per square metre per month against Pattaya's 393.5, roughly 35 percent above. Phuket's range runs 333.3 to 793.7 and Pattaya's 239.1 to 707.7.
This is the single most useful comparison on the page, and it is worth explaining why. Rent per square metre is one observable quantity rather than a ratio of two. It cannot be flattered by a motivated seller marking an asking price down, and it moves when a building is genuinely better rather than when its pricing changes. As a first screen it is more honest than any ratio.
Both figures are cross-source asking rents, grouped by named building and retained only where independent platforms agreed within a defined tolerance. They are what landlords are advertising. They are not achieved rents, no public source holds achieved condominium rents at this granularity, and nothing on this page should be read as what a unit rents for.
The spread inside each city is wider than the gap between them, which is the recurring finding across this whole research line. Pattaya's published buildings span nearly three times from the lowest consensus to the highest. Choosing the right market moves this number by about a third. Choosing the right building inside it moves the number by a multiple.
What does source coverage do to confidence in each city's figures?
Phuket's sale data draws on five platforms. Pattaya's draws on two, and is 99.6 percent one of them: 8,094 of 8,125 rows. The Phuket figures rest on broader corroboration, and that difference should change how firmly each set is held.
This is the caveat most likely to be skipped and it deserves the opposite treatment. A sale dataset dominated by a single platform inherits that platform's coverage, its geographic bias and its listing conventions. Where the platform is thin, the file is thin, and there is no independent signal available to reveal where those gaps are.
On the rent side the two are closer. Pattaya's rent collection drew on three platforms, returning 13,583 retained comparables across 729 named buildings, which is what made cross-source validation possible at all. Three is a workable minimum rather than a comfortable margin, and it is the reason 57 buildings reached multi-verified rather than several hundred.
Confidence tiers inside the two published files end up similar in absolute terms and different in proportion: Pattaya publishes 42 multi-verified and 9 mild-divergent, Phuket 43 and 18. Phuket carries a higher share of buildings whose platforms disagreed by a wider margin, which is a consequence of spreading across more areas with thinner local comparables.
How does the net range compare once costs are included?
Across each city's published file, the median building nets 4.74 percent in Phuket and 3.79 percent in Pattaya, a gap of 0.95 percentage points. Phuket's building-level range runs 3.20 to 7.69 percent; Pattaya's runs 1.97 to 7.29 percent, with the negative unit-level rows left in the file rather than removed.
Every one of those figures is computed from asking rents against asking prices, with vacancy, management, the building's common-area charge and property tax applied. They are holding figures. They are not round-trip figures, and treating a net figure as though it accounted for the cost of buying and the cost of selling is the most expensive arithmetic error available to a foreign buyer.
There is a seasonality caveat that applies to both markets and is not inside either number. These figures are gross of seasonality: they say nothing about how many months of the year the rent actually arrives. Both are coastal markets with visitor-driven demand patterns, and neither published figure models a vacancy profile specific to that pattern beyond the flat vacancy assumption applied to every building equally.
The band at the bottom of the Pattaya range is the more instructive end. It exists because the common-area charge is levied per square metre while rent does not scale as neatly with floor area, so large units in amenity-heavy towers can carry costs that the validated rent does not cover. The full teardown is in Pattaya rental yield, and the Phuket side, computed on a wider listing population and reported separately, is in Phuket rental yield. The country-level gross-to-net shrinkage is in the net yield gap study.
Which market suits an income-led buyer and which an occupation-led one?
On the published evidence, Phuket carries the stronger income case on both rent per square metre and net median, and Pattaya carries the stronger depth case for a buyer who wants many comparable units inside a small number of well-evidenced buildings.
What each market's structure actually gives a buyer
- Breadth of choice. Phuket, clearly. Eight evidenced catchments against two, and 1,515 named buildings against 320.
- Depth inside each published building. Pattaya, clearly. 2,233 units across 51 buildings against 1,235 across 61, which means more comparable units at the same address to price a specific unit against.
- Corroboration of the underlying data. Phuket, on the sale side, at five platforms against two.
- Entry at the bottom of the published range. Pattaya, whose lowest published building median sits below Phuket's.
For someone buying a unit to occupy rather than to let, most of the income comparison falls away. Vacancy stops mattering, management stops mattering, and what remains is the common-area charge, the property tax and whether the building is run well enough that the charge buys something. Those are building-level questions in either city. The Pattaya version of that arithmetic is in Pattaya for expats.
In both markets the same structural fact holds and it is the one worth carrying away: the spread between buildings inside a single catchment is larger than the gap between the two cities. Anyone choosing a city first and a building second has the order backwards.
What would make the answer flip?
Four things, and three of them are about the data rather than the markets. Broader sale-side coverage in Pattaya would be the largest single change, because the two-platform constraint is what caps confidence there.
The conditions under which this page would need rewriting
- A third and fourth sale platform covering Pattaya. Its named-building count would rise from 320, more catchments would likely clear the reporting threshold, and the two-catchment limit might turn out to be a property of the collection rather than of the city.
- Achieved transaction data in either market. Everything on this page is asking-side. A public source of transacted condominium prices would replace most of it and could move either city's position.
- A measured seasonality profile. Both net figures are gross of seasonality. Two markets with different occupancy patterns through the year could reorder on net once that is modelled properly, and neither file models it today.
- A rail link changing Pattaya's catchment logic. The transit-distance column is empty for all 8,125 Pattaya rows, so proximity currently cannot be measured at all. Where that variable exists it tends to become the strongest single organising fact about a condominium, as the Bangkok catchment work shows.
Until one of those changes, the position stated at the top holds: Phuket for breadth and income evidence, Pattaya for depth and entry level, and the building mattering more than the city in both. The full market picture for each is in the Pattaya property market for 2026 and the Phuket equivalent. The inland comparison on the same method is Chiang Mai versus Bangkok, and the regional versions are in Vietnam and the Philippines.
A city comparison is one page of it. Here is the file.
Free. One email. Instant download.
- Whether your name can legally go on the title — the quota check, applied to a unit rather than explained.
- What every platform asks for the unit, and what is left after costs — not one listing’s headline.
- Who actually buys it from you in five years — the exit a saturated building takes away.
Independent research. Instant access. Unsubscribe in one click.