
The Net Yield Gap: What 3,300+ Thai Condo Listings Reveal
The yield in the brochure is gross. It is the rent, divided by the price, before anything is taken out. It is the friendliest number anyone can show you, and it is the only one most listings show. So I ran 3,353 condo listings across Bangkok, Phuket and Chiang Mai through the same fee stack (vacancy, management, the building's maintenance fee, property tax), and watched what was left. Across the dataset, the median listing's net came out roughly a third below its gross. That gap is the whole study. The brochure number is not the number you keep.
The Finding, In One Line
THE NET YIELD GAP
This is not an opinion about Thai property. It is an arithmetic observation about a number convention. Gross yield ignores the cost of holding the asset. Net yield does not. The distance between them is predictable, it is large, and almost nobody publishes it. Because the people quoting yields are usually the people selling the unit. The same gap between the brochure number and the kept number is the reason buying property abroad needs its own underwriting framework, not a Western one.
City By City: Gross vs Net
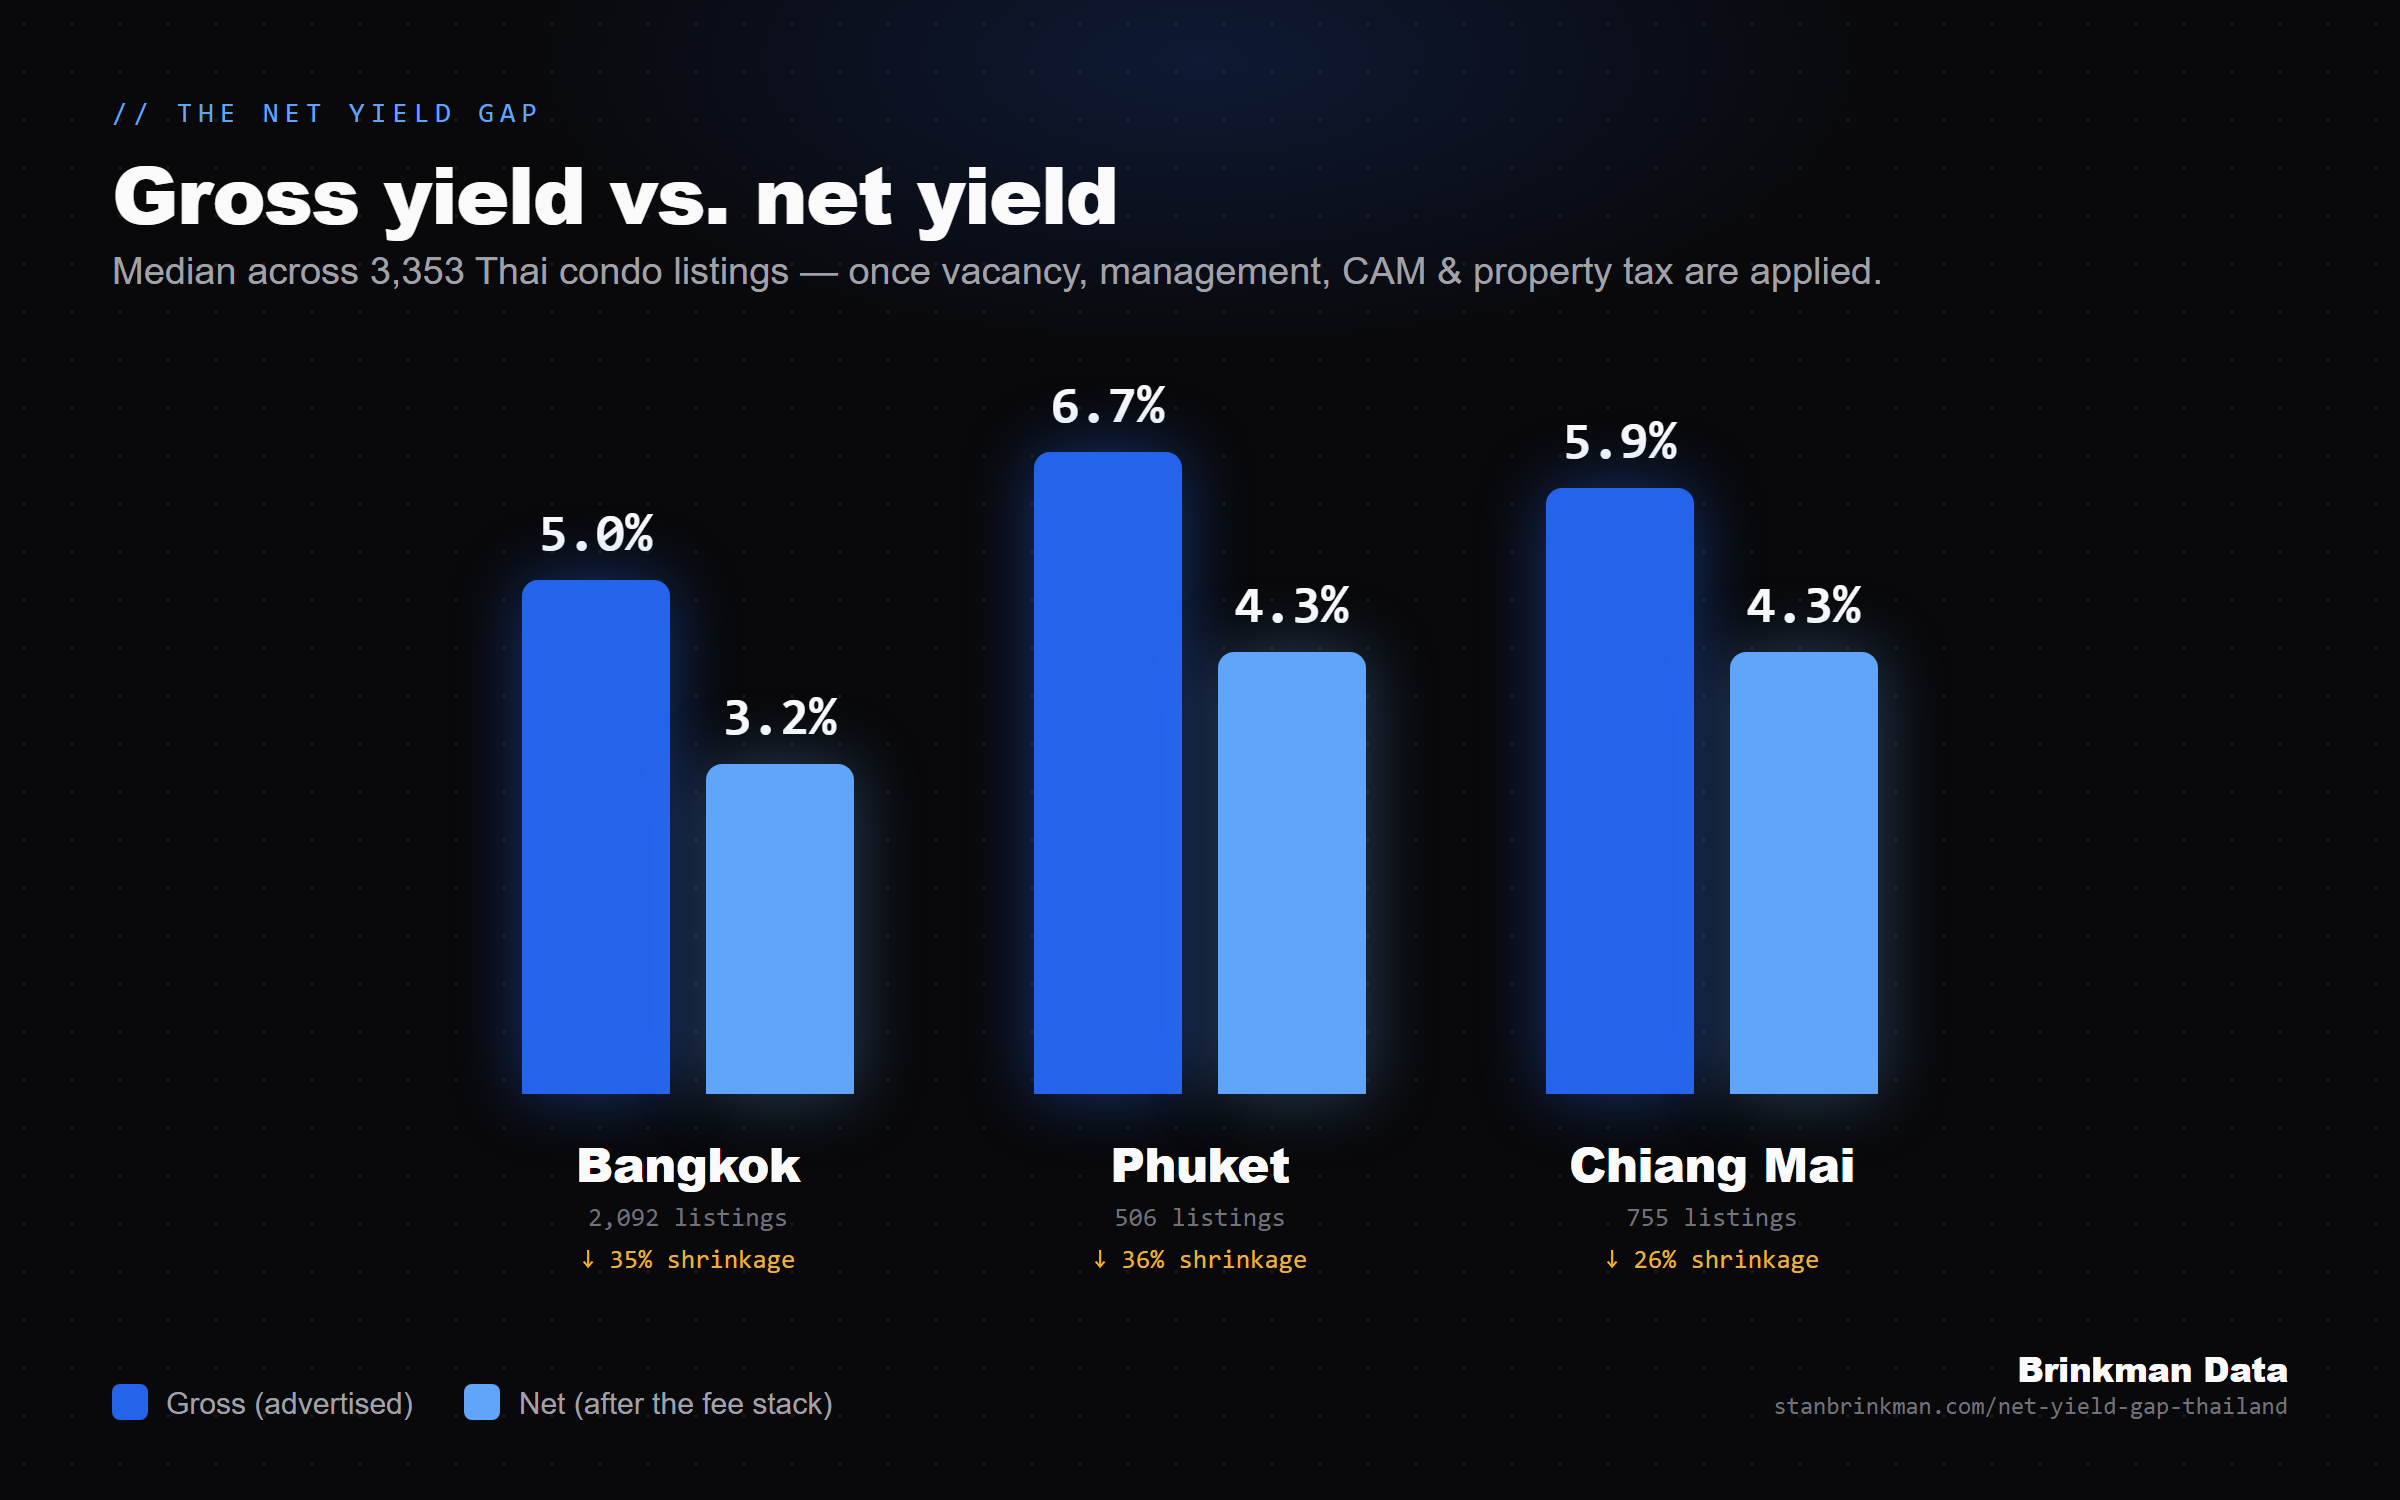
These are market statistics from public asking listings, not a return you will earn, and not a projection. Each row is the median across that city's listings, with the deduction stack applied identically. Read the spread, not a single hero number.
| City | Listings | Gross (median) | Net (median) | Shrinkage |
|---|---|---|---|---|
| Bangkok | 2,092 | ~5.0% | ~3.2% | ~35% |
| Phuket | 506 | ~6.7% | ~4.3% | ~36% |
| Chiang Mai | 755 | ~5.9% | ~4.3% | ~26% |
Medians, rounded. Gross = advertised rent over price. Net = after 15% vacancy, 12% management, the building's annual maintenance fee, and property tax. Chiang Mai's gap reads narrower partly because maintenance-fee coverage in its dataset is thinner. See the limitations below. Bangkok, with full fee coverage on all 2,092 listings, is the most defensible leg — its corridors are broken down catchment by catchment in the Bangkok best-areas ranking. Phuket's 506 listings are broken down catchment by catchment in the Phuket best-areas ranking.
Quartile spread tells the same story. In Bangkok, the middle half of listings sat between roughly 4.4% and 5.7% gross, and between roughly 2.8% and 3.7% net. The whole distribution moves down together. There is no sub-district where the gross number survives contact with the fee stack intact. How the two cities compare on the underwriting math.
Use this chart
Writing about Thai property yields? You are welcome to republish this chart. Copy the snippet below, it credits the study with a link back.
What Eats The Yield: The Fee Stack
The single biggest driver of the gap is the one a listing almost never prints: the building's common-area maintenance fee (CAM, the monthly per-square-meter charge that funds the building and its sinking fund). In this dataset the median building carried a five-figure annual CAM bill. On a modest unit, that line alone can move the yield by a full percentage point or more, and it is fixed, recurring, and unrelated to whether the unit is rented.
Then come the assumptions a seller never models: a 15% vacancy allowance (the months between tenants), a 12% management cost (someone has to run the unit), and property tax. None of these are aggressive. They are conservative-to-normal. They are also completely absent from a gross number. Why the sinking fund is the line that decides the deal.
Stack them and the brochure yield does not survive. That is not a Thailand problem and it is not unique to any one developer or market. It is what the gross-yield convention does everywhere it is used. The brochure is global. The math is the same in Lisbon, Dubai, and Da Nang.
How The Numbers Were Derived
A data study is only worth citing if you can audit it. Here is the whole method, in the open.
The dataset. 3,353 individual condo sale listings aggregated from public property portals across Bangkok, Chiang Mai and Phuket, each with a source URL retained. After ghost-listing and off-comparable removal, every surviving listing carries an asking price, size in square meters, sub-district, an estimated monthly rent, and the building's annual maintenance fee.
The rent. Rent is a per-building consensus drawn from across sources where more than one exists, 1,163 of the Bangkok buildings and 178 of the Phuket buildings carry multi-source-verified rent; Chiang Mai is single-source and flagged as the weaker leg. Rent is capped to a per-area sanity band to kill outliers. The yield comes out of the method, not the other way around. Phuket's thinnest beach-zone samples are disclosed as such — it is why the Bang Tao / Laguna and Karon / Kata pages publish attributed tracker figures instead of forcing a thin median.
The formula. Published so anyone can reproduce it:
effective = gross_annual × (1 − 0.15) # 15% vacancy
after_mgmt = effective × (1 − 0.12) # 12% management
net_income = after_mgmt − cam_annual − property_tax
gross_yield% = gross_annual / price × 100
net_yield% = net_income / price × 100
Constants: vacancy 15%, management 12%, property tax about 0.02% of price. The maintenance fee is the building's actual published figure where available, a heuristic fallback otherwise. This is the same pipeline and the same formula behind the paid Custom Reports. The method is public; only the per-client building picks are not.
What This Study Does Not Claim
These are asking-listing yields, not achieved yields. There is no public sold-price registry, so the inputs are public asking prices and consensus rents. Real closed prices tend to land below asking, which would move the gross numbers, but the gap between gross and net is the finding, and the gap is robust to that.
It is a 2026 snapshot, not a live feed. The dataset is point-in-time. Rents are estimates, not landlord-reported actuals. Chiang Mai's maintenance-fee coverage is thinner than Bangkok's, so its leg is the least certain.
None of this is investment advice, and none of these figures is a return anyone is promised. The point of the study is the gap and its cause, not a number to chase. For verified figures on a single documented title, see the case study.
CITE THIS STUDY
The framework that produced this study, in 20 pages.
Get The Thailand Protocol — $20How To Read Any Yield Number Without Getting Fooled
Refuse any yield that does not name its deductions. Gross yield minus what? If the maintenance fee, the vacancy assumption and the management cost are not on the page, the number is a marketing number wearing a spreadsheet costume.
Refuse any yield that does not separate asking from closed. Asking is what a seller wants. Closed is what a buyer paid. The two are not the same, and the gap is never in the buyer's favor on a brochure.
Refuse any single citywide average. A city-wide yield is an average of nothing in particular. Underwrite the building and the unit, not the city. The analytics approach this study comes out of.
The standard is brutal and simple: the number shows its work, or the number does not exist.