// Proprietary data · free to cite
Thailand Property Market Statistics (2026)
Every statistic on this page comes from Brinkman Data’s own analysis — 3,353 Thai condo listings modelled for the yield-gap study, plus per-area asking-price tables for Chiang Mai, Bangkok and Phuket from the validated 2026 pulls — not from recycled third-party reports. Each stat is written as a standalone, citable sentence with its sample size and source link. Journalists and bloggers: free to cite with attribution — bio, headshot and approved facts in the press kit.
The asking price of a condo in each of five Thai cities, side by side: how much is a condo in Thailand.
Last updated 2026-07-15
3,353
listings modelled
~⅓
gross-to-net overstatement
169
audited Chiang Mai listings
49%
foreign freehold quota
Key statistics, citation-ready
Each block is one fact, one sample size, one source. Copy the sentence; link the source.
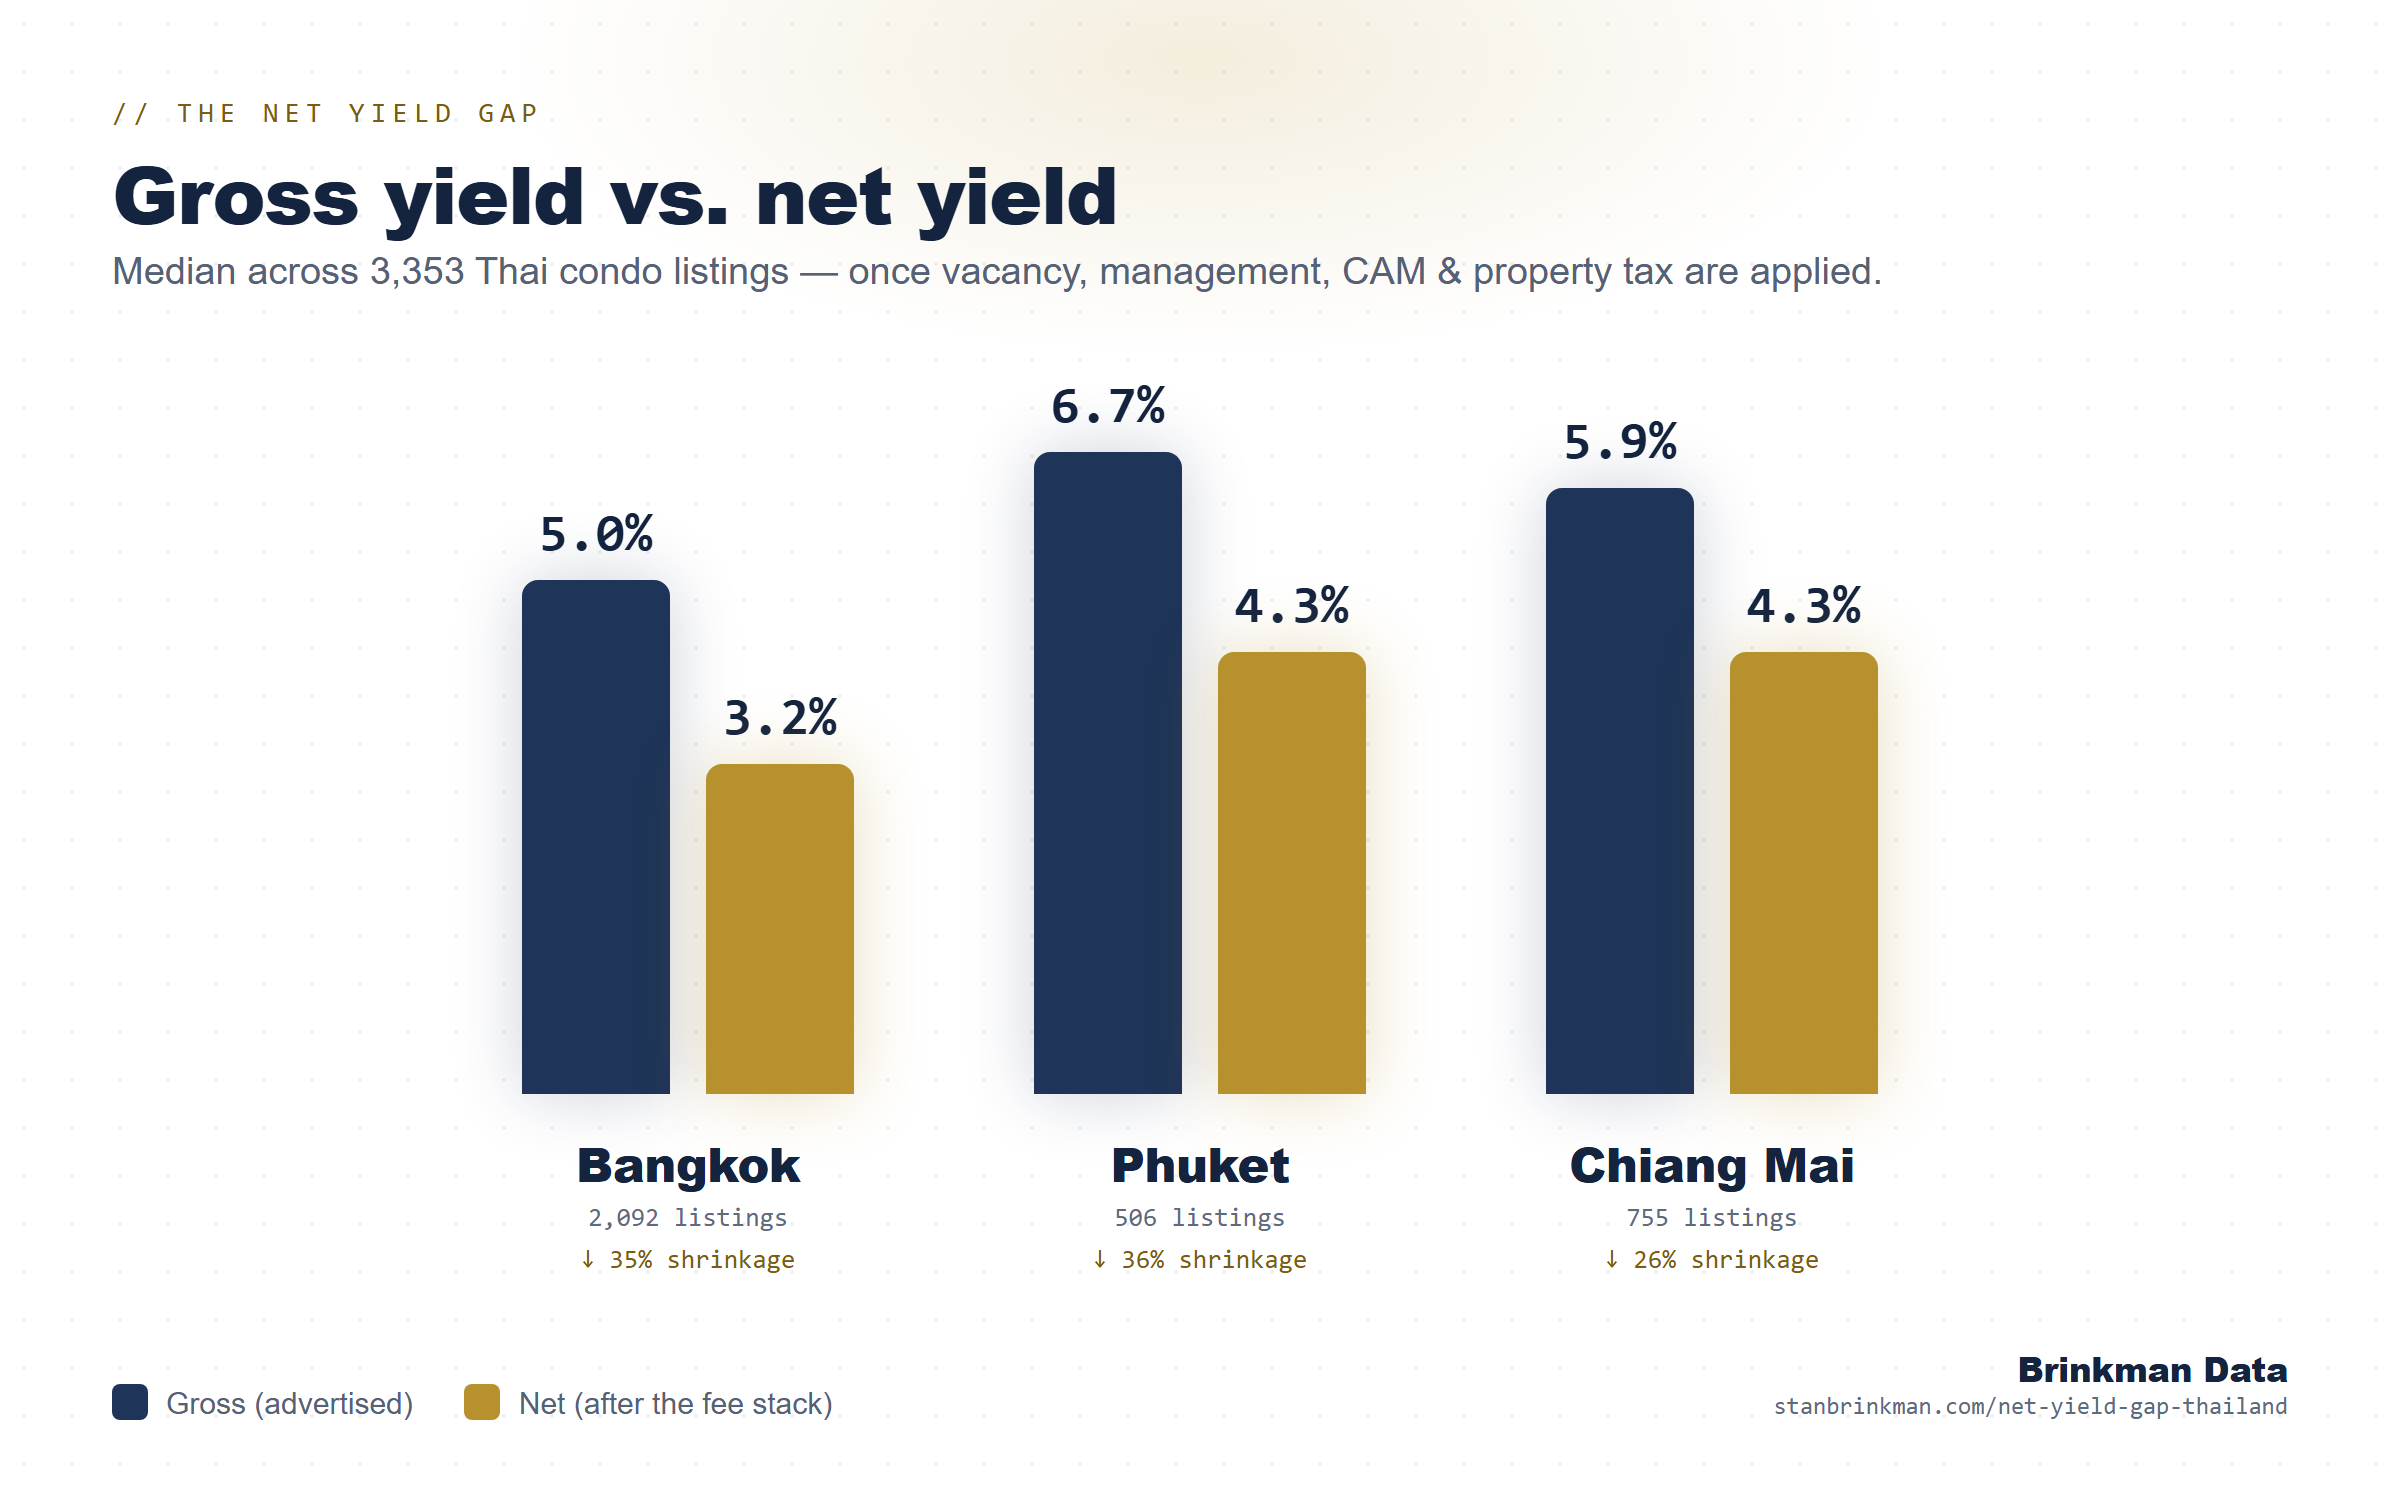
Across 3,353 Thai condo listings analysed in 2026, the advertised gross rental yield overstates the real net figure by roughly a third once vacancy, management, the building's maintenance fee and property tax are modelled.
Source: stanbrinkman.com/net-yield-gap-thailand · Brinkman Data, 2026 · #
Bangkok condos advertised a median 5.0% gross yield in the 2026 dataset; the modelled net figure after the full cost stack is 3.2%.
Source: stanbrinkman.com/net-yield-gap-thailand · Brinkman Data, 2026 · #
Phuket condos advertised a median 6.7% gross yield in the 2026 dataset; the modelled net figure after the full cost stack is 4.3%. The island prices catchment by catchment, not as one market — the Phuket area-by-area breakdown ranks all eight.
Source: stanbrinkman.com/net-yield-gap-thailand · Brinkman Data, 2026 · #
Chiang Mai condos advertised a median 5.9% gross yield in the 2026 dataset; the modelled net figure after the full cost stack is 4.3%.
Source: stanbrinkman.com/net-yield-gap-thailand · Brinkman Data, 2026 · #
Nimman (Nimmanhaemin) carries Chiang Mai's deepest rental catchment, with family-size units asking a median 80,500 THB per square metre in the 2026 audited pull (n=26).
Source: stanbrinkman.com/chiang-mai-best-areas-to-buy · Brinkman Data, 2026 · #
Chang Khlan / Night Bazaar carries Chiang Mai's most expensive audited condo stock at a median asking price of 108,000 THB per square metre (n=14), skewed by the premium river-tower segment.
Source: stanbrinkman.com/chiang-mai-best-areas-to-buy · Brinkman Data, 2026 · #
Riverside (Wat Ket) is Chiang Mai's cheapest audited condo catchment at a median asking price of roughly 52,700 THB per square metre (n=24), with a median building age near 28 years.
Source: stanbrinkman.com/chiang-mai-best-areas-to-buy · Brinkman Data, 2026 · #
On Nut / Bang Chak is Bangkok’s largest validated listing bucket in the 2026 analysis (n=391), with a median asking price around 125,000 THB per square metre in the 3–12M THB band.
Source: stanbrinkman.com/bangkok-best-areas-to-buy · Brinkman Data, 2026 · #
Thonglor / Ekkamai ranks first of eight Bangkok catchments in Brinkman Data’s 2026 area analysis, at a median asking price of 6.00M THB in the 3–12M band — a scarcity-anchored market where the analysis band clips the top end.
Source: stanbrinkman.com/bangkok-best-areas-to-buy · Brinkman Data, 2026 · #
Phuket Town is the island’s cheapest validated condo entry point in the 2026 analysis: a median asking price of 4.26M THB and roughly 96,900 THB per square metre (n=266) — with a resale market that leans domestic rather than foreign.
Source: stanbrinkman.com/phuket-best-areas-to-buy · Brinkman Data, 2026 · #
Thalang / Airport Corridor is where Phuket’s new condo supply is landing: roughly 119,000 THB per square metre at the median (n=137) in the validated 2026 cut — the island’s second-largest listing bucket after Phuket Town.
Source: stanbrinkman.com/phuket-best-areas-to-buy · Brinkman Data, 2026 · #
Foreigners can hold at most 49% of the saleable floor area of a Thai condominium building in freehold; the quota is tracked per building, which is why the same unit can be freehold-available in one tower and not the next.
Source: stanbrinkman.com/thailand-foreign-freehold-explained · Brinkman Data, 2026 · #
Gross vs net rental yield, by city
From the 3,353-listing study. Net models vacancy, management, the building’s maintenance fee and property tax. Full method: the net yield gap study.
Republish this chart — embed code
<img src="https://stanbrinkman.com/images/net-yield-gap-thailand-chart-wg.png" alt="Thailand gross vs net rental yield by city — Brinkman Data"><br>Source: <a href="https://stanbrinkman.com/thailand-property-statistics">Thailand property market statistics — Brinkman Data</a>
Chiang Mai: median asking price per m², by area
From the 2026 hand-audited pull (n=169, family-size skew 60–160m²; asking prices, not closed prices). Santitham is published as an index against Nimman — its sample is too thin for a standalone median. Full ranking and verdicts: the best-areas guide.
| Area | Median asking ฿/m² | n |
|---|---|---|
| Nimman (Nimmanhaemin) | ฿80,500 | 26 |
| Jed Yod / Chang Phueak | ฿78,600 | 31 |
| Old City (inside the moat) | ฿64,700 | 3 |
| Hang Dong / Mae Hia | ฿58,600 | 16 |
| Riverside (Wat Ket) | ฿52,700 | 24 |
| Chang Khlan / Night Bazaar | ฿108,000 | 14 |
Bangkok: median asking price by area (3–12M THB band)
From the 2026 rent-validated cut (1,072 of 2,092 listings validated). Asking prices, not closed prices. Full ranking, method and per-area verdicts: the Bangkok best-areas guide.
| Area | Median asking | Median ฿/m² | n |
|---|---|---|---|
| Thonglor / Ekkamai | ฿6.00M | ~136,800† | 53† |
| Ari / Saphan Khwai | ฿5.39M | ~152,800 | 147 |
| On Nut / Bang Chak | ฿4.95M | ~125,000 | 391 |
| Huai Khwang / Cultural Centre | ฿4.60M | ~128,800 | 170 |
| Asoke / Phrom Phong | ฿6.80M | ~158,100 | 165 |
| Silom / Sathorn | ฿7.00M | —‡ | —‡ |
| Ratchada / Rama 9 | ฿4.75M | ~145,300 | 146 |
| Chatuchak / Lat Phrao | ฿4.79M | —‡ | —‡ |
† Thin or band-clipped sample — disclosed in full on the area guide. ‡ No bucket in the rent-validated cut; the guide publishes the case-study median with attributed benchmarks instead.
// Building level
This table is the area-level picture. The Bangkok Condo Buyer’s Guide is the building-level one, built from the same rent-validated cut: 89 named buildings, 907 validated units, every column filled, and a written account of the 13 buildings that were dropped.
Phuket: median asking price by area (3–12M THB band)
Every resale listing in the 3–12M THB eligible band from the 2026 Phuket pull — 6,171 listings across 8 areas, with distinct buildings counted separately. Asking prices, not achieved. Full ranking and verdicts: the Phuket best-areas guide.
| Area | Median asking | Median ฿/m² | Listings | Buildings |
|---|---|---|---|---|
| Bang Tao / Laguna | ฿6.50M | ~142,816 | 1,903 | 255 |
| Patong | ฿6.25M | ~109,704 | 407 | 126 |
| Thalang / North | ฿5.60M | ~124,904 | 808 | 129 |
| Surin / Kamala | ฿5.55M | ~123,823 | 447 | 103 |
| Karon / Kata | ฿5.50M | ~122,222 | 541 | 96 |
| Rawai / Nai Harn | ฿5.27M | ~113,961 | 862 | 186 |
| Kathu / Central | ฿4.70M | ~91,499 | 300 | 79 |
| Phuket Town | ฿4.25M | ~100,000 | 903 | 182 |
Computed from the full 2026 Phuket pull rather than a validated subset, so every area above rests on 79 buildings or more. Per-building detail — named buildings, validated rents and confidence tiers — is not published here.
Pattaya: median asking price by tambon
The 2026 Pattaya pull returned 8,125 rows, which deduplicate to 4,903 distinct listings across 320 named buildings, capped at ฿12,000,000. Median asking price city-wide is ฿4,310,000. By tambon: Nong Prue ฿4,322,958 across 3,983 listings in 242 buildings, which is where Pratumnak and much of Jomtien sit, and Na Kluea / Wongamat ฿4,147,050 across 854 listings in 56 buildings. Asking prices, not achieved. Nong Pla Lai and Sattahip returned four listings each and carry no published median. Full per-area tables, price bands and the thin-sample disclosures: Pattaya condo prices by area; the catchment ranking is best areas to buy in Pattaya, and the market-level counts behind both are in the Pattaya property market for 2026.
How to cite this page
Brinkman Data (2026). Thailand Property Market Statistics. https://stanbrinkman.com/thailand-property-statistics
Attribution required. Data may be quoted, charted and republished with a link to this page or the underlying study.
Want the method behind the numbers?
The $20 Protocol is the 5-step framework these datasets are built on. Instant PDF.
Get The Protocol — $20