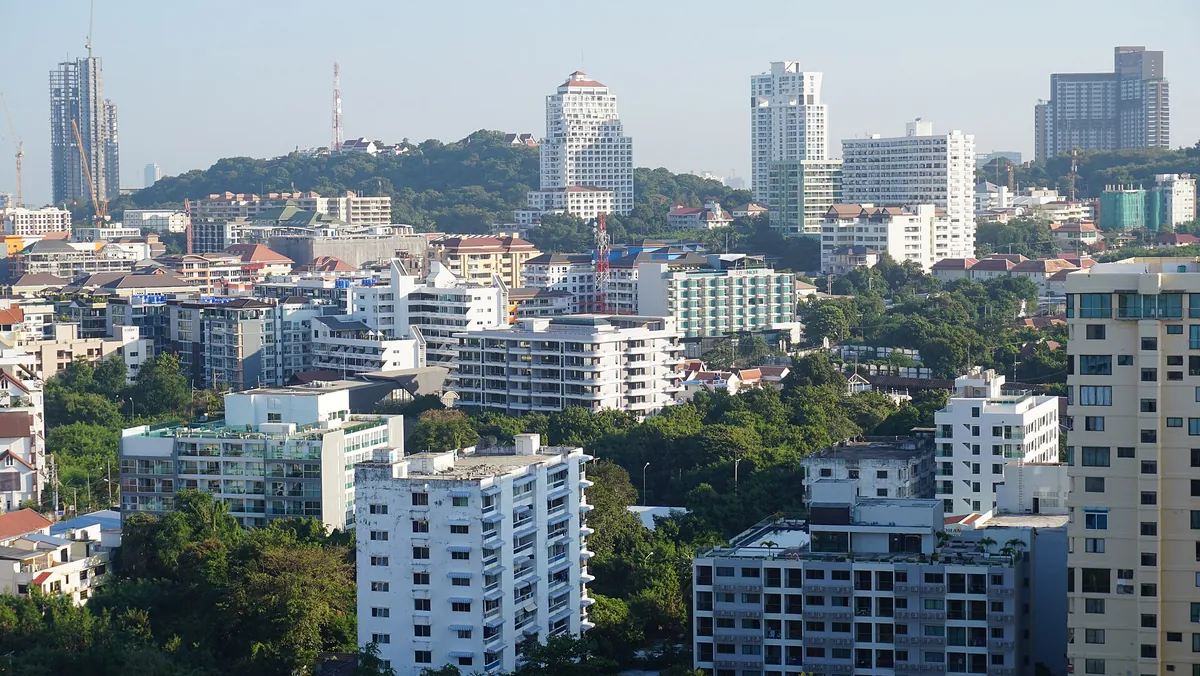
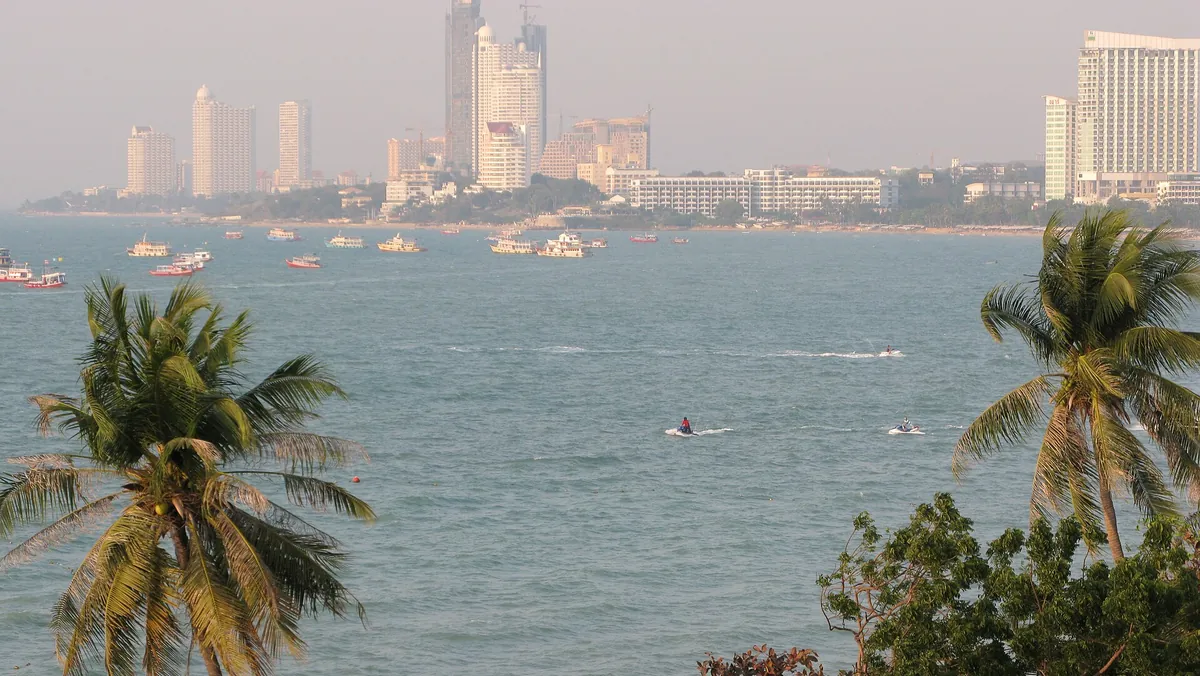
This is not a survey of Pattaya. It is two catchments — Nong Prue and Na Kluea-Wongamat — done properly.
2,233 units across 51 named buildings, every one carrying an observed foreign-quota marker. 96 of 147 buildings were cut before publication. What is left is what survived the standard.
// What this covers, and what it does not
Pattaya spreads across a lot of administrative ground, and most of it does not carry enough rent evidence to underwrite. Rather than thin the standard until the whole city fitted, I kept the standard and published the two catchments that cleared it.
Covered: Nong Prue (37 buildings, 1,886 units) and Na Kluea-Wongamat (14 buildings, 347 units).
What was held and dropped: Bang Lamung had two buildings qualify on unit count and both were cut for weak rent evidence. Nong Pla Lai and Sattahip carry almost no condo inventory — three buildings and three between them across the whole pull — so nothing from either reached the unit bar.
Pratumnak and much of Jomtien sit inside Nong Prue. They are almost certainly represented in the 37 buildings above, but the underlying data reports by tambon and I cannot separate them out honestly. So I am not going to publish a Pratumnak count or a Jomtien count. The catchment is the unit of measurement here, and the file says so on every page.
// The problem
Most foreign buyers pick a Pattaya building the same way. A photograph. A floor plan. A number quoted in a brochure, or whichever unit sits in a portal’s featured tier. What the unit actually rents for, and what is left after vacancy, management, common-area maintenance and tax, gets discovered afterwards.
A brochure was never built to answer that question, and neither was a listing page. Both rank on what is easiest to show. That is how property is marketed everywhere — it is not a Pattaya problem and it is not anyone local’s fault.
The fix is boring. Apply one standard to every building, publish what survives, and publish what did not.
// A sample row
Deliberately split: the left card shows the price side, the right card the yield side, on two different buildings. The file itself carries both on one row.
// The standard
Rent is never taken from one source. Asking rents are collected per platform, filtered, then combined into a per-building consensus that biases to the lower median wherever two platforms disagree materially.
Short-stay and serviced listings are removed before the data is built, because a tourist nightly rate parses as a monthly rent and wrecks the number. Pattaya carries more of that inventory than anywhere else in the line, which is a large part of why 96 buildings did not make it.
Where a building’s own rent evidence sits well above its area and age cohort, the rent is re-estimated back down to the cohort median. No premium is assumed for a name.
A row is published only when the rent survives all of it. That is the whole reason this file is 51 buildings and not 147.
// What did not make it
This is the heaviest exclusion rate of any file in the line, and I would rather put it in the headline than bury it. A thinner standard would have produced a longer file and a worse one.
91 buildings were cut because their rent evidence came from a single source and could not be cross-checked. 5 were cut on a data flag.
Every one of the 51 that remain carries an observed foreign-quota marker. 51 of 51.
// Before you buy it
It is two catchments, not the city. If you want Jomtien reported separately, this file does not do that and I am not going to pretend otherwise.
It is not live data. It is a September 2026 pull, labelled that way on every page. If you want a file collected the week you order, that is the Custom Report.
The quota marker is observed, not confirmed. It means foreign-quota availability was visible for that building at the time of the pull. Actual slot availability changes and has to be confirmed with the building’s juristic office at the point of purchase.
I do not sell property. No commission, no introductions, no referral fees. That is why a building can appear in this file with numbers that argue against buying it.
// What is in the file
All 51 of them, grouped by catchments. If the building you are looking at is not on this list, the file does not cover it and you should know that before you buy, not after.
// 2,233 units · 51 buildings · two catchments
Every building named, with its unit count, size range, asking band, rent basis and quota marker. Plus the written account of the 96 that were cut.
Instant PDF · 28 pages · 7-day refund, no questions asked.
Credited in full against the $499 Custom Report if you commission within 30 days.
The other cities
Brinkman Data Analytics is an independent research service. Not financial, investment, tax, or legal advice. All yield figures are estimates based on historical research data and are not guaranteed. International real estate carries risk of partial or total loss of capital.