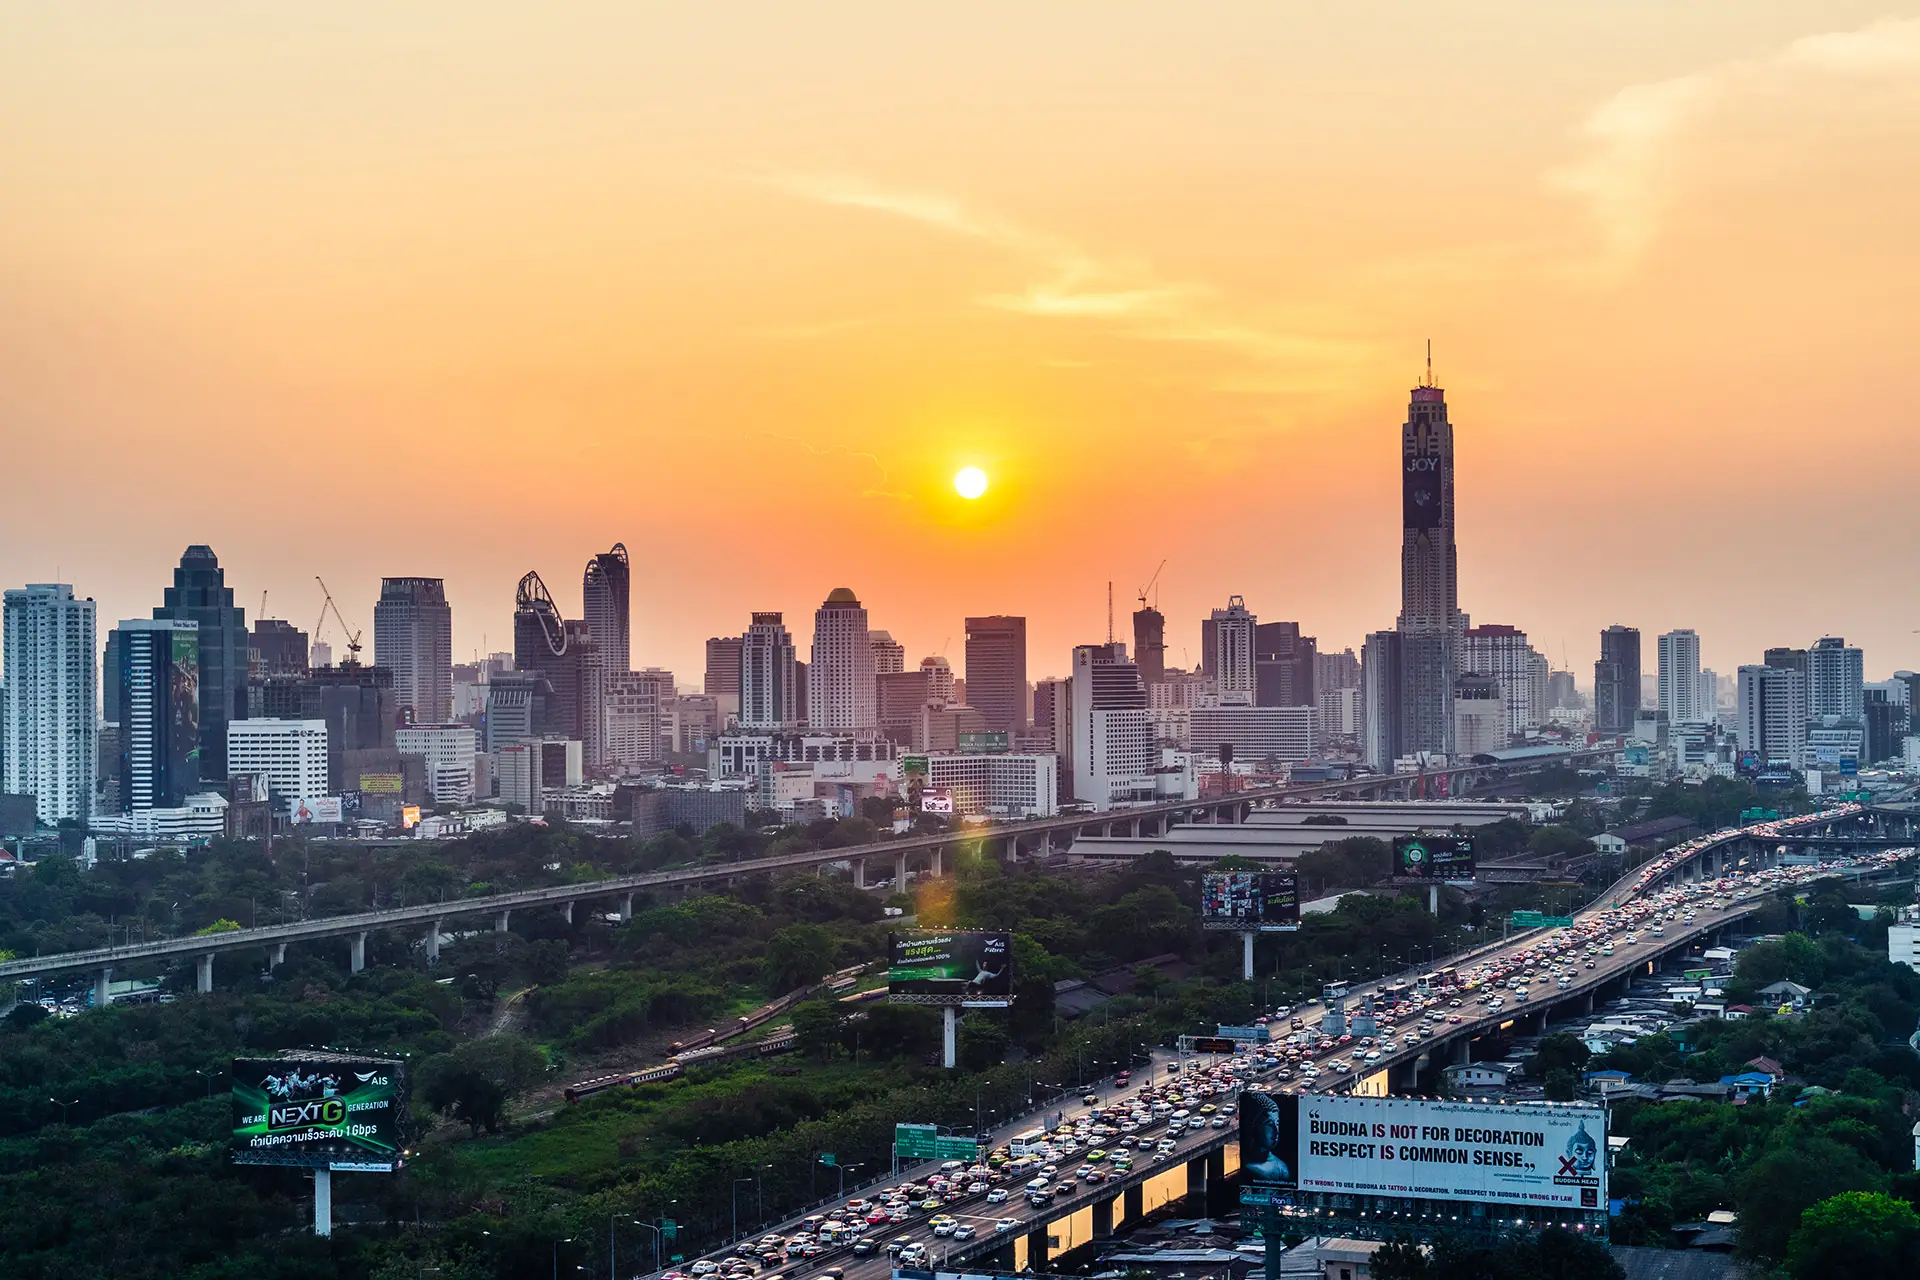
Bangkok Rental Yield: The Number Is Flatter Than Anyone Selling You a Corridor Admits
Bangkok is the largest and most defensible leg of my Thai dataset, and it produces the least exciting yield story in the country. That is the finding, not a disclaimer.
// Short answer
What is the rental yield on a Bangkok condo?
Across 2,092 Bangkok condo listings in a 2026 scan, the median advertised gross yield was roughly 5.0 percent and the median net yield was roughly 3.2 percent once vacancy, management, the building's maintenance fee and property tax were applied. That is a shrinkage of about 35 percent. Both figures are asking-listing figures, because there is no public registry of closed Thai condo prices.
Bangkok is the most defensible leg of the three-city study, because every one of those 2,092 listings carries full fee coverage. Phuket ran roughly 6.7 percent gross to 4.3 percent net. Chiang Mai ran roughly 5.9 percent to 4.3 percent. Bangkok starts lowest and finishes lowest, and it is the leg I would defend hardest in writing. Pattaya was pulled later and is reported differently, building by building across two catchments rather than area by area: what 51 validated Pattaya buildings net.
The quartile spread says the same thing the median does. In Bangkok the middle half of listings sat between roughly 4.4 and 5.7 percent gross, and between roughly 2.8 and 3.7 percent net. The whole distribution moves down together. There is no corridor in the city where the advertised number survives contact with the fee stack intact.
One reconciliation, stated openly. My commissioned Bangkok report describes net yields inside the filtered eligible band clustering higher than the citywide median. That band is a screened slice, not the market. Both figures are true and they measure different things.
What is the difference between gross and net rental yield in Bangkok?
Gross yield is annual rent divided by the asking price and deducts nothing. Net yield subtracts a vacancy allowance, a management cost, the building's annual common-area maintenance fee and tax. Across the Bangkok dataset the gap between the two ran about 35 percent of the headline. Gross is what a listing prints. Net is what reaches your account.
The formula is published so anyone can reproduce it. Gross annual rent is reduced by a 15 percent vacancy allowance, then by a 12 percent management cost, then the building's annual maintenance fee and property tax are struck. The maintenance fee is the single largest driver of the gap and the line a listing almost never prints.
It is also the line that behaves differently from every other one. Maintenance is charged per square metre per month by the juristic person, typically around 40 to 70 baht per square metre in Thailand. It is fixed, recurring, and completely indifferent to whether a tenant is in the unit. Rent stops. That charge does not.
The four deductions between the brochure and the bank
- Vacancy allowance. The months the unit sits empty between tenants.
- Management cost. Placement, rent collection, maintenance coordination.
- Common-area maintenance fee. Per square metre, per month, payable whether or not the unit is let.
- Tax. Rental income tax and the annual land and building tax.
Which areas of Bangkok have the highest rental yields?
In the commissioned Bangkok report the area-level gross yields across the eight transit-anchored catchments run from about 4.72 percent in Ari and Saphan Khwai to about 5.26 percent in Chatuchak and Lat Phrao, with Thonglor and Ekkamai at about 5.16 percent and Asoke and Phrom Phong at about 4.83 percent. The full ranking is below. These are gross figures before any deduction.
Look at that range again before you use it. The distance between the highest and the lowest of the eight is under sixty basis points on gross. Once the fee stack goes through and each building's own maintenance charge is applied, that spread narrows further and in some pairings it inverts.
A handful of thinner districts outside the transit-anchored eight post higher gross in the same report, including Ratchaprarop and Pratunam at about 6.71 percent. Both are flagged thin, meaning fewer than three eligible buildings. A gross yield computed across two buildings is an anecdote with a decimal point.
Bangkok catchments by area-level gross yield, commissioned 2026 report
- Chatuchak and Lat Phrao, about 5.26 percent. Northern value, interchange at Mo Chit.
- Thonglor and Ekkamai, about 5.16 percent. Land scarcity, the ranking's strongest rents.
- On Nut and Bang Chak, about 5.08 percent. The BTS value corridor, deepest sample.
- Huai Khwang and Cultural Centre, about 5.00 percent. MRT catalyst tier, cheapest entry.
- Silom and Sathorn, about 4.96 percent. Mature office-anchored CBD.
- Ratchada and Rama 9, about 4.92 percent. Deep tenant pool, weakest resale trend.
- Asoke and Phrom Phong, about 4.83 percent. Prime liquidity, not prime growth.
- Ari and Saphan Khwai, about 4.72 percent. Supply-constrained Thai owner-occupier demand.
Why are Bangkok rental yields so flat across corridors?
Because the city prices rent and capital against each other with unusual efficiency. Corridors with the strongest rents also carry the strongest asking levels, so the ratio compresses. Across the eight transit-anchored catchments in my scan the area-level gross figures sit inside a band under sixty basis points wide. In Bangkok, yield is not the variable that separates one corridor from another.
This is the most useful thing in the dataset and almost nobody says it, because saying it removes the reason to pitch you a corridor. If yield is flat, choosing between Thonglor and Huai Khwang on yield is choosing on noise. What is not flat in Bangkok is supply, resale velocity, tenant depth and the trend.
It also means the corridor at the top of the gross table is not the prize. Chatuchak and Lat Phrao tops the eight on gross and does not break out as its own bucket in my rent-validated cut, so I hold no per-square-metre median of my own for it. Top of a table, thinnest evidence. That combination should always slow you down.
Stop shopping for a Bangkok corridor by yield. Start shopping by what the asset has to do: produce rent, produce a fast exit, or produce a defensible trend.
How much does BTS and MRT proximity matter to Bangkok rent?
It sets the tenant pool, and the tenant pool sets the rent. Every catchment in my Bangkok scan is transit-anchored, and the sampled asking rents track the depth of the professional and expat base around each station rather than the distance to the river or the view. Thonglor and Ekkamai posted the highest sampled median asking rent in the scan at roughly 29,300 baht a month across 53 validated listings.
The rest of the rent picture from the rent-validated cut of 1,072 listings, all asking rents. Asoke and Phrom Phong posted a median near 27,100 with a middle half of roughly 23,600 to 33,500 across 165 listings. Ari and Saphan Khwai posted a median near 21,100, middle half roughly 18,600 to 28,000, across 147. On Nut and Bang Chak, the deepest sample in the scan at 391 validated listings, posted a median near 20,700, middle half roughly 17,200 to 28,200.
Ratchada and Rama 9 posted a median near 22,000 across 146 listings, fed by the office cluster around the interchange. Huai Khwang posted the lowest of the eight at a median near 18,600, with a wide middle half of roughly 12,800 to 25,400, because that corridor mixes older stock with newer investor builds.
The arbitrage most buyers miss is arithmetic, not aesthetic. On Nut sits about fifteen BTS minutes from Asoke at a 25 to 40 percent discount to Asoke pricing. Ari is a twelve-minute run to Siam on a low-rise zoning footprint that caps new supply. Neither fact shows up in a yield number. Both decide the tenant.
Why does unit size distort Bangkok yield numbers?
Because the sampled stock is not family stock and the maintenance fee scales with floor area rather than with rent. Validated median unit sizes in my Bangkok cut run 35 to 48 square metres per corridor, from a 35.5 square metre median in Ratchada and Rama 9 to 48 square metres in Thonglor and Ekkamai. These are investor-grade studios and one-beds, and any yield built from them describes that segment only.
Size cuts both ways in the arithmetic and most buyers only notice one direction. A small unit carries a smaller maintenance bill because the charge is per square metre. It also carries a shallower tenant pool, faster turnover and a resale market made almost entirely of other investors rather than of people who want to live there.
The second distortion is the price ceiling. My ranked cut stops at 12 million baht, which clips the prime tier in Thonglor entirely. The corridor median in my data describes the Ekkamai-weighted eligible band, not the postcode, and I say so on every page where the number appears.
The Thailand Underwriting Protocol is the 5-step sequence behind every number on this page: the quota check, the maintenance-fee load test, the vacancy stress test, the title screen and the exit check. It is the same sequence I ran on the 2,092-listing Bangkok cut.
Get The Protocol — $20Which Bangkok corridors carry oversupply risk?
Ratchada and Rama 9 carries the weakest five-year resale trend of the six corridors I track with validated data, at a tracker-synthesis midpoint near 1.5 percent a year on the resale side over 2020 to 2025. On Nut and Bang Chak is still clearing a 2018 to 2022 supply wave, with older Bang Chak stock reported flat to negative on resale. The north around Chatuchak and Lat Phrao has a long resale queue where launch supply landed hardest.
The pattern underneath all three is the same and it is not a Bangkok problem. New-launch headline pricing and secondary-market reality diverge whenever supply arrives faster than the resale queue absorbs it. That happens in every city on earth that builds towers, and the brochure never plots both lines on the same chart.
This is why a strong rent number does not settle the question. Ratchada and Rama 9 has a genuinely deep long-stay tenant pool fed by the office cluster, honest entry pricing and a real rent base. It also has the weakest exit story in the set. Buy the tenant depth if that is the job. Do not underwrite the exit at the brochure's number.
Is asking rent the same as achieved rent in Bangkok?
No. Every rent figure in my Bangkok data is an asking rent taken from public listings, cross-checked across sources where more than one exists and capped to a per-area sanity band. Achieved rent from a signed lease lands below asking. Treat every published Bangkok rent as a ceiling and underwrite beneath it.
Both legs of any published Bangkok yield are asking figures, on the rent side and on the price side, because Thailand has no public sold-price registry. That does not invalidate the gross-to-net gap, which is the actual finding and is robust to it. It does mean the absolute yield number is softer than its decimal places suggest.
The practical correction is local and unglamorous. Property managers running active books in a specific corridor know what units sign for. Portals know what owners hope for. Cross-reference at least two managers operating in your corridor, and do it for the specific building rather than for the station name.
What vacancy rate should I assume for a Bangkok condo?
My published study applies a 15 percent vacancy allowance across the whole Thai dataset, which is conservative-to-normal rather than pessimistic. Vacancy in Bangkok is not uniform: the commissioned report records prime luxury vacancy in the strongest corridors running at roughly 4.2 to 5 percent against a materially higher city-wide figure. Where your building sits on that spread is a building-level question, not a corridor-level one.
That gap is why a citywide vacancy assumption is close to useless. A prime, supply-capped corridor with a deep expat tenant base and a fringe tower competing against three identical launches are not the same asset, and averaging them describes neither.
So set the assumption at the building. Ask the juristic person how many units are currently let. Count the lit windows on a weeknight. Ask the managing agent how long the last three units took to place. A vacancy assumption inherited from a brochure is not an assumption. It is a wish.
How do I calculate the net rental yield on a specific Bangkok condo?
Take the annual rent, apply a vacancy allowance set to that building rather than the city, subtract a management cost, subtract the building's actual annual maintenance fee and any sinking-fund obligation, subtract tax, then divide by total capital deployed rather than by the sticker figure. Capital deployed means purchase plus legal fees plus whatever share of transfer costs you carry. The free rental yield calculator runs that stack for you.
The denominator is where most amateur models leak. Legal fees, transfer costs and furnishing spend are capital you deployed and never see again, and a yield computed against the sticker figure quietly pretends they did not happen.
Then stress it. Apply a rent drop and an extra empty month, and see whether the unit still clears your hurdle. If it only pencils when nothing goes wrong, it never pencilled. Run that stack across every unit on the shortlist, because comparing net to net is the only comparison that means anything. Comparing two brochure gross figures tells you which seller is more optimistic.
Is Bangkok a rental yield market or a liquidity market?
A liquidity market. Bangkok posts the lowest gross and the lowest net of the three Thai cities in my study, and it offers the deepest tenant base, the fastest resale and the most defensible data in the country. If the job of the asset is current rent, Phuket ran roughly a point higher on net. If the job is a clean exit and a verifiable trend, Bangkok is the answer.
Every corridor is really a bet on one of three jobs. Appreciation is the short list: Thonglor and Ekkamai, and Ari and Saphan Khwai, where supply is structurally capped. Rental operation is the value corridors, where entry pricing is honest and the tenant pools are deep. A fast exit is Asoke and Phrom Phong, and Silom and Sathorn, and you accept a flat trend as the fee for it.
One structural note that applies to all of them. A condominium unit inside the building's 49 percent foreign quota is the direct freehold path for a foreign buyer in Thailand, registered at the Department of Lands. The quota is per building and slots move, so confirm the remaining position in writing before any deposit, and read how Thai foreign freehold actually works before anyone offers to explain a structure to you.
What actually goes wrong: the corridor that rents beautifully and exits badly
Take Ratchada and Rama 9, because it is the honest failure mode rather than the dramatic one. The rental case is genuinely strong. The office cluster around the interchange feeds a deep long-stay tenant pool, sampled asking rents post a median near 22,000 baht a month across 146 validated listings, and entry pricing is among the most honest in the ranking. On rent alone it looks like the buy.
Then the exit arrives. Of the six corridors I track with validated data, industry trackers place this one's five-year resale trend at the bottom of the set, near 1.5 percent a year on the resale side over 2020 to 2025, because new-launch pricing and secondary-market reality have diverged here more than anywhere else in the ranking. The rent was never the risk. The exit was.
The same trap runs at the unit level, and I can show it on my own money. I own a unit in Chiang Mai that a listing would have printed at roughly 6.74 percent gross. Strike the common-area fee, the property tax and a maintenance reserve, and count capital deployed rather than sticker, and it produces 5.00 percent net. Add the letting fee a buyer who is not me would pay, at 8 percent of gross, and it produces 4.46 percent. Three numbers, one apartment.
That is the Bangkok discipline in one line. The city's yields are flat enough that the yield is not the decision. The decision is supply, resale velocity and whether the building can evidence its own occupancy.
Free, before you sign
The Thailand condo breakdown
The 49% foreign-quota check, the full cost stack, and a worked case study of a unit I own in Chiang Mai. One email, instant download.
The Bangkok yield checklist: what to pull before you model anything
- Twelve months of common-area maintenance invoices for the unit, in writing from the juristic person.
- The most recent sinking-fund call and any pending capital works.
- The building's remaining 49 percent foreign quota position, in writing, before any deposit.
- How many units in the building are currently let, and how long the last three took to place.
- Achieved rent evidence from at least two property managers in that corridor.
- The unit size, because the maintenance charge scales with square metres and the tenant pool does not.
- The building's resale record: how long comparable units have sat, and at what discount to asking.
- Whether the building is new-launch repriced stock or the older cohort in the same corridor.
- Total capital deployed, including legal fees, transfer costs and furnishing spend, as the denominator.
- A stress test: a rent drop plus an extra empty month, still clearing your hurdle.