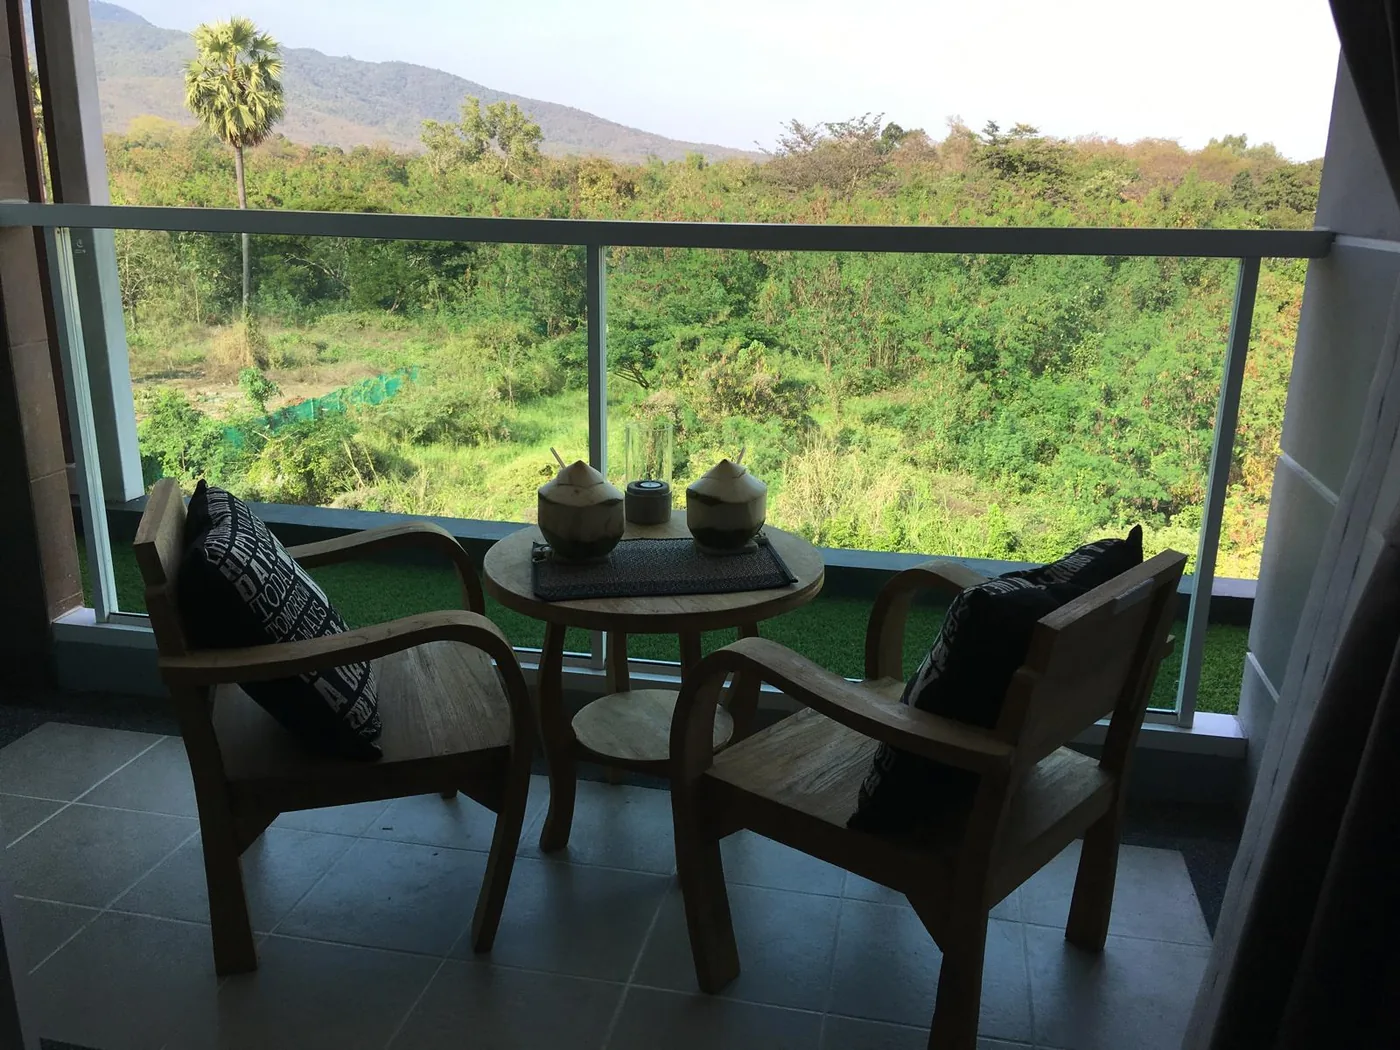
The view from the unit: green valley and misty foothills west of Chiang Mai, seen from the balcony.
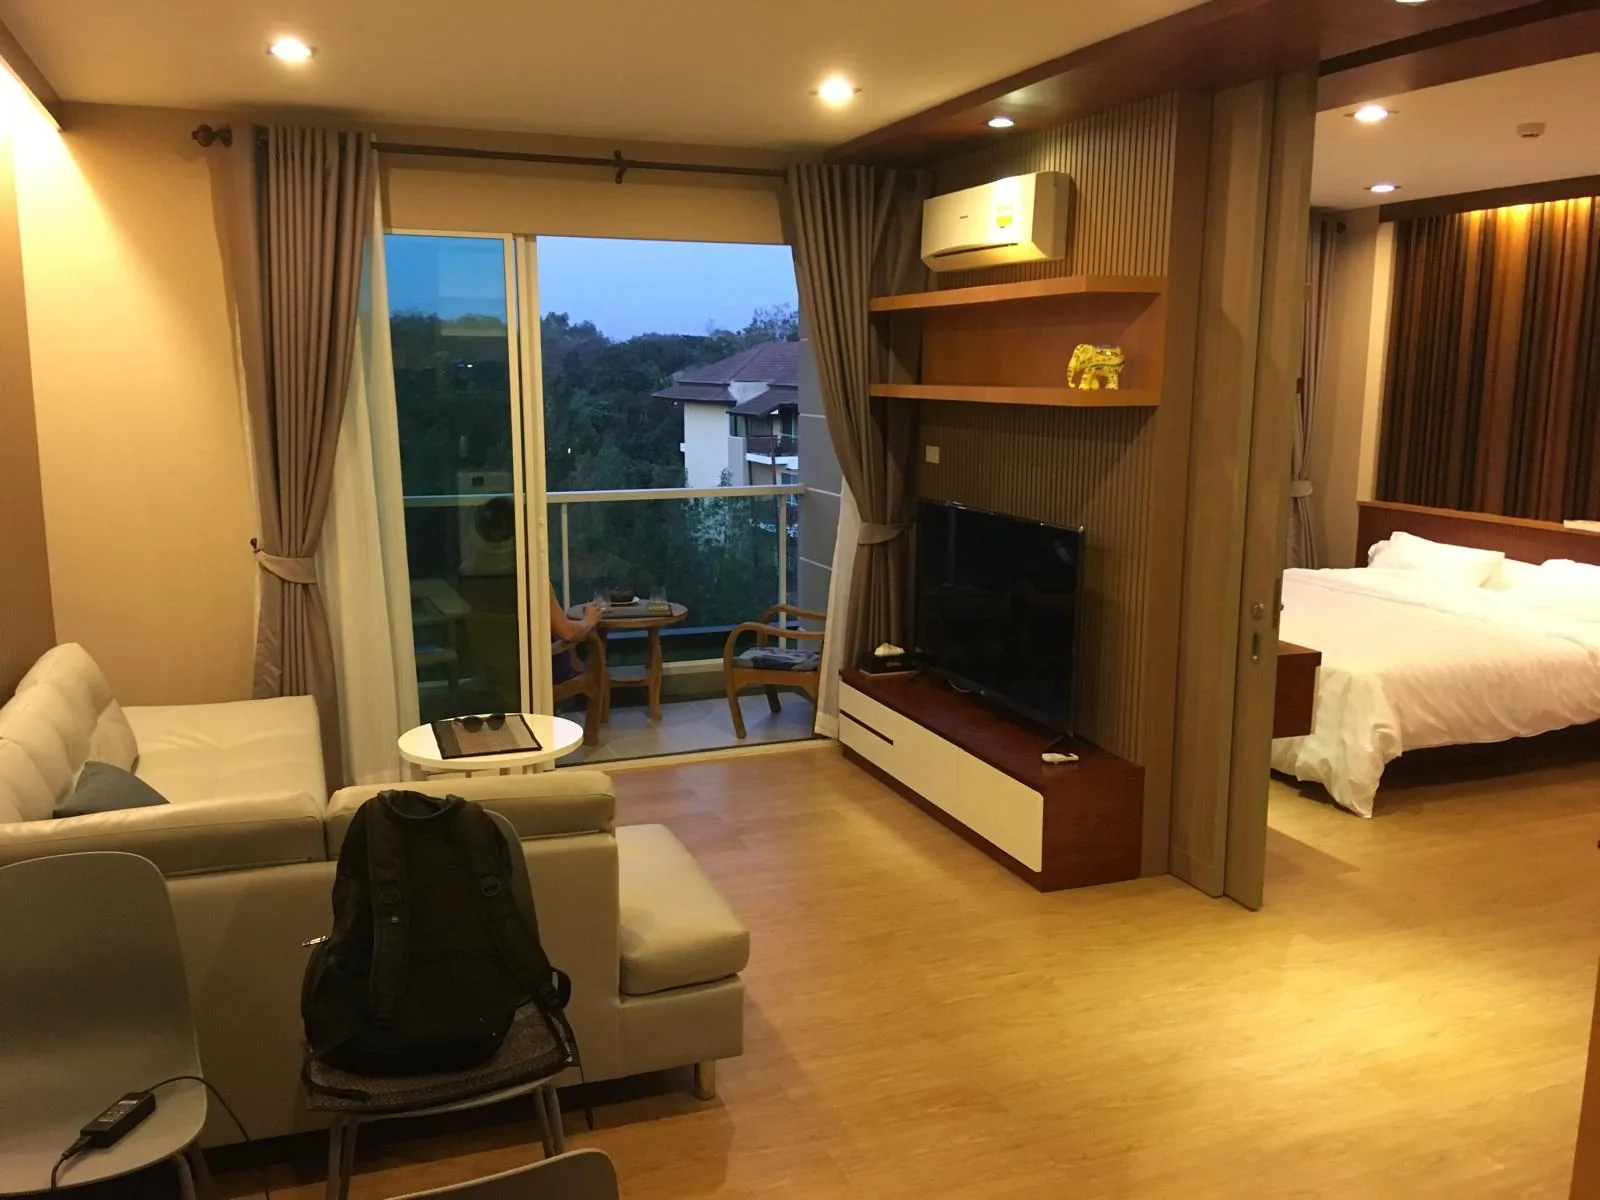
The Rajapruek Greenery Hill unit in Hang Dong, Chiang Mai: 49 square metres, open-plan living and sleeping area with a balcony over the valley.
Owned Since 2018 · Chiang Mai · Held

The unit I bought before I had a method.

One apartment. Every receipt. 2,850,000 THB, 5.00% net, freehold, let for four years. This is the one that does not clear my own filter — and the exact reason the filter exists.

True Net Yield
5.00%
After every fee
Capital Deployed
2,860,000
THB, all-in
Held Since
2018
Freehold · Let 4 years
The balcony of the Rajapruek Greenery Hill unit looking over the valley and the foothills west of Chiang Mai.
What I actually bought: the view. It is also the reason the rent ceiling sits where it does.

The Receipt

Every line. Every deduction.

Gross is a story. Net is the receipt. This unit collects 192,000 a year and a listing would print 6.74%. The 49,000 THB that never reaches me is the entire difference between a brochure and a ledger.

Asset: Rajapruek Greenery Hill, Hang Dong

Unit Purchase Price (2018): 2,850,000 THB
Legal Fees:
+ 10,000 THB (Contract check only)
Transfer Fees:
+ 0 THB (Carried by seller)
Total Capital Deployed: 2,860,000 THB
Gross Rent (16k x 12 mos): 192,000 THB/yr
Operational Deductions
Minus: Letting Agent Fee (let direct) - 0 THB
Minus: Annual CAM Fee - 30,000 THB
Minus: Annual Property Tax - 9,000 THB
Minus: Maintenance Reserve (modelled) - 10,000 THB
True Net Income: 143,000 THB/yr
True Net Yield: 5.00%

Purchase price, legal fee, CAM, property tax and rent are the actual figures on this unit. Only the maintenance reserve is modelled — it is not a receipt, it is the reserve I would require of any buyer underwriting this asset. Strike it and the number reads 5.35%. I do not think that is honest on a unit that has been let for four years.

The Gap

Three numbers. One apartment.

The same unit produces a different figure depending on where you stop counting. Every brochure stops at the first one. Most owners, including me for years, stop at the second.

  1. 01

    Gross — 6.74%

    192,000 of rent against 2,850,000 of sticker price. This is the figure a listing prints. It deducts nothing, and it assumes the asking price was the real cost of ownership.

  2. 02

    Owner math — 5.68%

    Take out the CAM and stop. This is the number I quoted myself for years, and it is the number most owners will quote you over a beer. It is not wrong. It is unfinished.

  3. 03

    Underwritten — 5.00%

    Every line struck. CAM, property tax, a maintenance reserve, and capital deployed rather than sticker price. This is what the asset does. It is the number I would want if I were the one buying it from me.

And one more, for a buyer who is not me

I let this unit direct, so there is no agent line above. Someone buying it from me would have to hire that out. Price letting at 8% of gross, another 15,360 THB leaves, and 5.00% becomes 4.46%. Self-managing is not free. It is unpaid work showing up as yield.

The Diagnosis

Why this one nets half of the other one.

Galae Thong Tower nets 8.15%. This unit nets 5.00%. Same city, same buyer, same currency. Four differences explain almost all of it, and none of them are luck.

Cause · 01

The CAM Load

30,000 THB a year against 192,000 of rent is 15.6% of gross gone to common-area maintenance. Galae Thong runs 12,000 against 228,0005.3%. Nearly three times the drag. Low-density projects sold on gardens, space and quiet cost more to run, and no listing prints that number.

→ Run this filter on your own listing — $20
Cause · 02

Price Against Rent

32.6% more capital for a unit that rents for 15.8% less. 2,850,000 buying 16,000 a month, against 2,150,000 buying 19,000. That one ratio moves gross from 10.6% to 6.74% before a single cost is deducted.

→ Run this filter on your own listing — $20
Cause · 03

No Screen Ran

I got the fee stack right by instinct: the seller carried the transfer fee, and legal was 10,000 for a contract check. But I never pulled achieved rents inside the compound, never tested how fast units this size resell, and never modelled the CAM before signing. I bought a view and did the arithmetic afterwards.

→ The five filters that exist because of this
Cause · 04

What The Area Did Next

2,850,000 over 49 m² is 58,163 THB/m², paid in 2018. My own Hang Dong and Mae Hia pull puts the 2026 median asking at 58,600 THB/m² across a thin sample of 16 condo listings. Asking is not achieved, and 16 is not a market. But on the only benchmark I hold, the per-square-metre case has not moved.

→ Every Chiang Mai catchment, ranked

I am not selling this unit. It is freehold, it is in my name, and it has been let for four years. But it is not 8.15%, and the difference is not luck. It is the four items above. Each one became a filter.

★★★★★ 5.0 / 5 · Verified Gumroad Reviews

What buyers are saying

★★★★★

“Wasn’t expecting much for the price, but the yield breakdown is surprisingly dense. Worth it just for the data extraction framework alone. Straight to the point, no BS.”

Anonymous · Verified Buyer
★★★★★

“Exactly what I was looking to get started in buying a condo. I feel confident now that I’m not starting from scratch. Stan told me I could reach out to him if I ever got stuck — quite reassuring.”

Paco S. · Verified Buyer
★★★★★

“I used to spend a lot of time driving around Chiang Mai, scrolling real estate websites and visiting agents. This document convinced me to go further with Brinkman Data Analytics. It will save me a lot of time.”

Jan B. · Verified Buyer

See all reviews on Gumroad →

Want to replicate this?

Stop buying like a tourist.

The protocol exists because of the unit above. The PDF gives you the framework, the fee table, the legal checklist, and the Chiang Mai acquisition that cleared all of it line-by-line. $20. 7-day refund. No upsells.

Get The Protocol $20

Or see what a paid report looks like →

// What changed after this one

This one I bought on instinct. The next one I bought on a full Chiang Mai scan, and it nets 8.15%. Same city, same buyer, a method in between. See the acquisition that cleared every filter →

// Want the rest of the story?

⚠ Disclaimer

Brinkman Data Analytics is an independent research service. Not financial, investment, tax, or legal advice. All yield figures are estimates based on historical research data and are not guaranteed. International real estate carries risk of partial or total loss of capital.

Get The Protocol $20