
Chiang Mai Real Estate Data Built From 1,000+ Audited Listings

I analysed 1,000+ Chiang Mai property listings over 18 months. Nimman, Old City, Santitham, Hang Dong, Mae Hia, Riverside, Doi Saket. Then I threw out the half that were ghost listings. Units already sold, units priced far off any comparable, units that came off the market before the foreign-quota letter arrived. What was left became the Chiang Mai real estate dataset I now underwrite from. It is not the biggest dataset in Thailand. It is the only one I trust, because I built it by hand.
Why Most Chiang Mai Real Estate Data Is Wrong
The dominant Chiang Mai real estate data online comes from three sources: portal listings, agent-reported "averages," and macro reports written by people who do not live here. All three are systemically wrong, and the errors all bias the same direction. Toward higher prices and friendlier yields than the actual market produces. The sub-district map most listings hide.
Portal listings are wrong because Chiang Mai listing portals are not transaction databases. They are asking-price databases, and roughly 70-80% of Chiang Mai properties sell below asking. Using listing data as transaction data overstates real prices by 8-15%, depending on sub-district. In Nimman the gap is smaller. In Hang Dong it can be larger. The rental-yield data that comes out of this dataset.
Single-source averages are wrong because they include the publisher's own pipeline. Any agency anywhere that closes 30 units a year and quotes "average price per square meter in Nimman" is quoting its own book, not the market. The selection bias is invisible to the reader and obvious to anyone who has audited the underlying inventory.
Macro reports are wrong because they aggregate Chiang Mai with greater Thailand, weight by transaction volume that includes Bangkok and Phuket, and arrive at numbers that describe nothing specifically. A national "house price index" chart tells you nothing about a 60m² unit in Santitham.
This is the gap the Chiang Mai real estate data I publish is built to close. One city. One analyst. One method.
The 5-Step Method Behind the Chiang Mai Real Estate Dataset
I underwrite every Chiang Mai unit through the same five-step protocol. The dataset is what comes out the other end after the protocol is applied to a thousand listings.
Step 1: Foreign-quota verification. Every unit in the dataset has a confirmed foreign-quota status. The 49% Foreign Freehold rule means roughly 15-16 buildings in Chiang Mai have filled their quota and cannot legally sell to foreign buyers. Those units come out of the dataset before any pricing analysis runs. The remaining inventory is the only inventory that matters to a foreign buyer. Every building inside the dataset, ranked.
Step 2: Carrying-cost reconstruction. Every unit in the dataset has its common-area fee, sinking-fund obligation, property tax, and realistic vacancy assumption modeled. The asking price is a number. The carrying cost is the number that decides whether the asking price is fair.
Step 3: Comparable-transaction triangulation. Every unit in the dataset is benched against at least three closed transactions in the same sub-district, same building age bracket, same square-meter band. The triangulation is what converts an asking price into a defensible offer.
Step 4: Title-document review. Every unit in the dataset has been screened for Chanote integrity and encumbrance status. Units with title irregularities come out of the dataset.
Step 5: Walkout math. Every unit in the dataset has a walkout number. The price above which the deal stops working. The walkout math is what protects the dataset from optimism creep, which is the failure mode of every other property dataset I have seen published for Chiang Mai.
That is the methodology. Five steps, applied a thousand times, over 18 months. The output is the dataset. The dataset is the only Chiang Mai real estate data I am willing to defend.
THE DATA SHOWS ITS WORK OR IT DOES NOT EXIST
The dataset behind every report. Sample inside.
See The Sample ReportWhat the Dataset Caught That Nobody Else Publishes
The dataset caught the gap between headline price and all-in price on developer units in central Mueang Chiang Mai. Listed price at 3.4M THB. Real all-in price at 3.74M THB. I walked out of one of these in person. The 340,000 THB number did not appear on any listing portal because portals only show the headline. The dataset shows what closes.
The dataset caught the foreign-quota concentration. Roughly 15-16 buildings in Chiang Mai have filled their 49% allocation. If you do not know which 15-16 they are, you waste weeks negotiating units the Land Office cannot register in your name. The dataset names them. The portals do not.
The dataset caught the unit the marketing overlooked. Most foreign buyers anchor to a handful of brochure-famous projects and never run the math on the rest of the market. The dataset ranks every building on net yield after the full deduction stack, not on marketing spend. The Chiang Mai unit I closed surfaced from that ranking: a central Chang Khlan unit whose net yield held where pricier brochure units did not.
The dataset caught the ghost-listing problem. Roughly a third of Chiang Mai condo listings on the major portals are stale. Units already sold, units relisted at different prices by a different agent, units long sold but never delisted. Without removing those, every "average price per square meter" calculation is broken before it starts.
How To Use Chiang Mai Real Estate Data Without Getting Fooled
Refuse any Chiang Mai real estate data source that does not show you its inputs. If the source quotes "average price per square meter in Nimman" without naming the buildings, the data is opinion in a spreadsheet costume.
Refuse any Chiang Mai data source that does not separate asking from closed. Asking is what sellers want. Closed is what buyers paid. The gap matters and it changes by sub-district.
Refuse any Chiang Mai data source that quotes yields without showing the deduction stack. Gross yield minus what? Common-area fee at what THB-per-square-meter rate? Vacancy at what assumption? If the deduction stack is missing, the yield number is a marketing number.
Refuse any Chiang Mai data source that aggregates across sub-districts. Nimman is not Hang Dong. Riverside is not Mae Hia. A single citywide average is a citywide average of nothing in particular.
The standard is brutal but the standard is also simple: the data shows its work or the data does not exist.
Chiang Mai Rental Yield: Run The Net Number Yourself
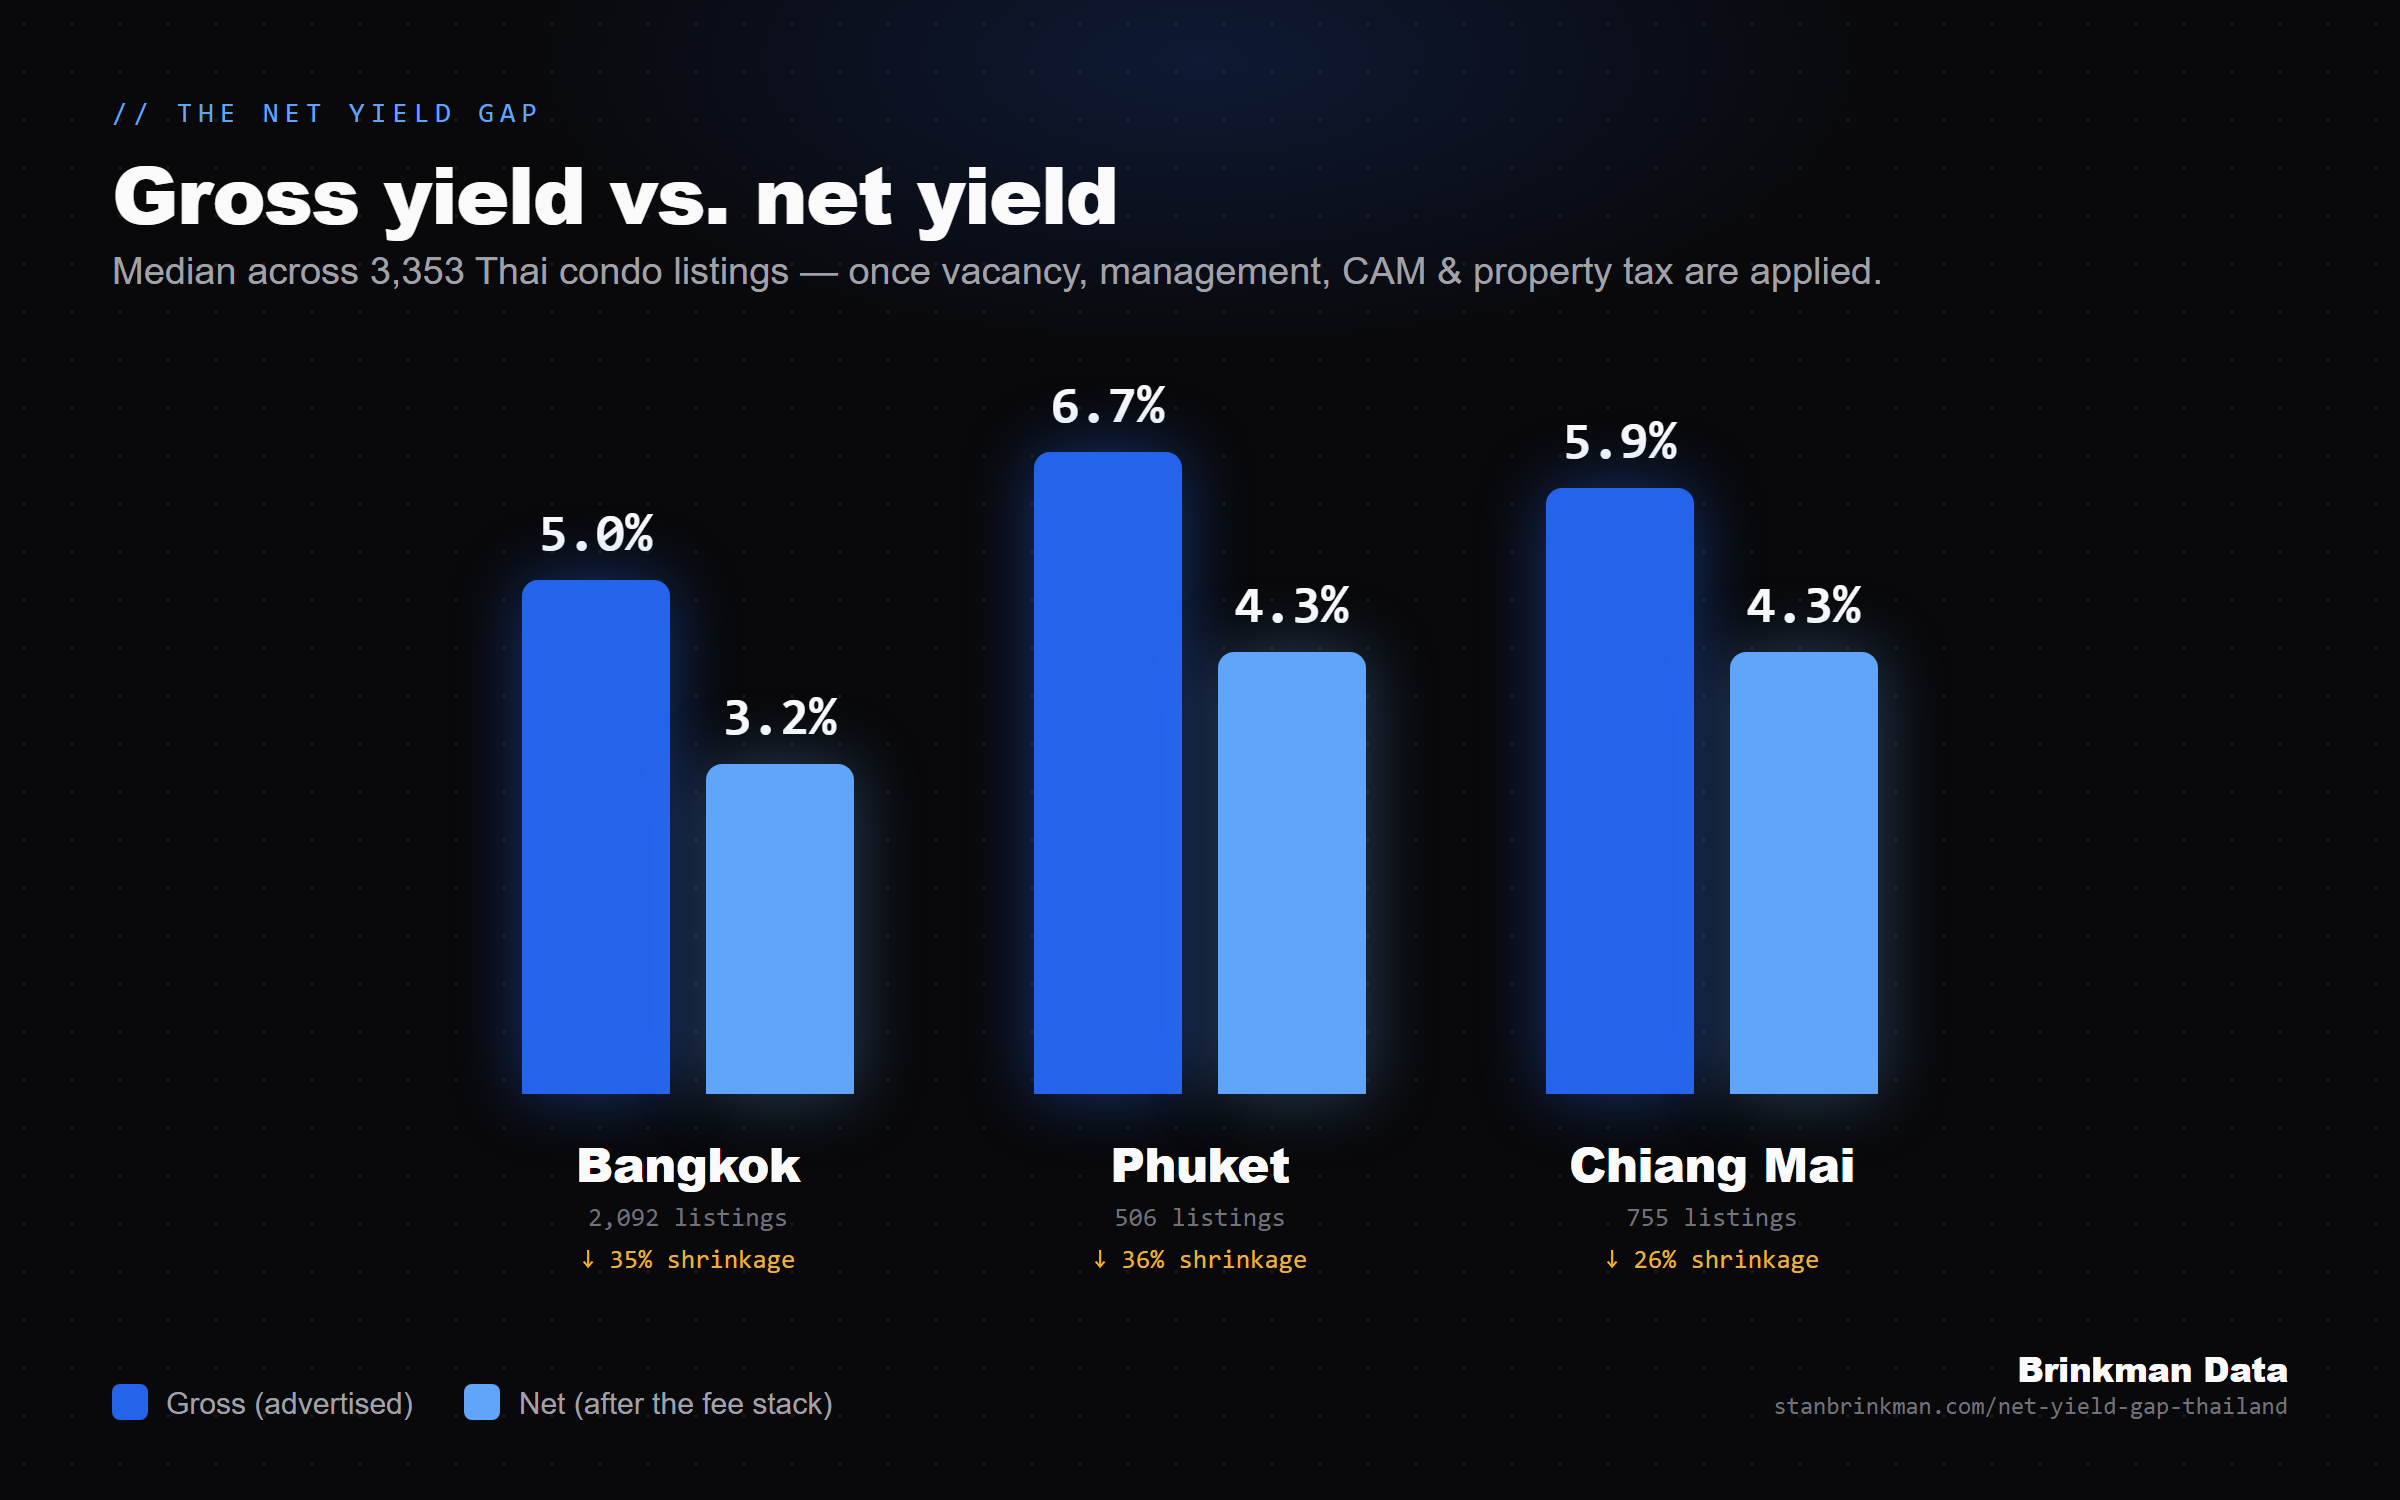
The whole point of the dataset is that a gross yield is not a real yield. Across the audited set the gross figure compresses once the deduction stack is applied: the common-area fee, the sinking fund, vacancy and management. The same gap shows up in every market measured.
Run the same gross-to-net math on any unit. Enter a price and a rent, and the calculator applies the deduction stack the dataset uses.
Open the full rental yield calculator, or the Thailand version with local defaults built in.
Cite this data
Across 755 audited Chiang Mai condo listings, roughly 70 to 80 percent sold at or below asking, and 15 to 16 buildings sit at full foreign quota. Net yield held near 4.3 percent after the full deduction stack.
Source: Brinkman Data, Chiang Mai Real Estate Dataset (2026).